Permian Operators: Stop Losing $10–$20 on Midland Cushing
The Midland-Cushing differential is the price gap between WTI crude at Midland, Texas and WTI at the Cushing, Oklahoma storage hub, and it directly changes what shows up on your division order. When Midland trades at a discount to Cushing, your realized wellhead price drops below the Nymex headline number you see on the news. When it flips to a premium, as it has done at various points since the pipeline buildout finished, you get paid more than that headline number. Either way, ignoring it means your well cost book is guessing.
TL;DR:
- The Midland-Cushing differential is mainly driven by pipeline capacity, export demand, and storage levels, causing frequent short-term volatility.
- Using dedicated hedging instruments that reference Midland-specific prices reduces basis risk compared to Cushing-based contracts alone.
- Recent infrastructure improvements have compressed the historic wide discounts, making the spread narrower but more prone to rapid fluctuations.
- Relying on outdated average discounts or manual settlement reconciliation can lead to significant errors in well revenue calculations.
- A real-time pricing view tied to actual well data enables operators to anticipate and manage differential movements effectively.
Table of Contents
- What Is the Midland-Cushing Differential and Why Does It Exist?
- How the Differential Gets Calculated and Quoted
- Instruments Operators Use to Hedge Midland Exposure
- What Actually Moves the Spread
- Turning the Differential Into a Realized Price You Can Book
- How WellsManager Keeps the Differential From Slipping Through the Cracks
- How Volatile Has the Spread Really Been?
- Where Mid-Cush Sits Next to Other Regional Spreads
- Pipeline Approvals and Tariff Rules That Move the Spread
- Storage Limits at Cushing and Midland That Squeeze the Spread
- Real Examples of the Spread Blowing Out and Snapping Back
- Common Mid-Cush Mistakes and the One Fix That Pays Off Fastest
- Get the Differential Out of Your Head and Into Your Well Cost Book
- Sources
- FAQ
What Is the Midland-Cushing Differential and Why Does It Exist?
Midland crude and Cushing WTI are not identical products sitting in the same place. Midland WTI is a distinct physical grade, and it typically runs 41 to 43.5 degrees API with about 0.20% sulfur, which makes it slightly lighter and sweeter than the barrels that settle the Nymex contract at Cushing. Refiners pay attention to that gravity and sulfur number because it changes yield, and pricing desks bake it into every trade.
The basic framing looks like this: Midland price equals Cushing price, plus or minus the differential, plus or minus transport and quality adjustments. That “plus or minus” matters more than people think. For years the formula only subtracted, because Midland crude had nowhere to go and traded at a steep discount. Once export capacity caught up, the sign flipped for stretches, and transport costs started acting almost like an add rather than a deduction.
Location drives most of the gap. Cushing sits at the center of a pipeline network with easy access to Midwest refineries and, indirectly, the Gulf Coast. Midland sits at the wellhead end of the Permian, hundreds of miles from either. The basis between the two reflects:
- Pipeline tariffs and capacity utilization between the Permian and downstream hubs
- Quality adjustments tied to API gravity and sulfur content
- How much crude is trying to leave the basin versus how much pipe exists to move it
- Gulf Coast export demand pulling barrels away from Cushing
How the Differential Gets Calculated and Quoted
Traders do not just eyeball a spread. There is a defined mechanical process, and it starts with the Nymex CMA, the calendar month average of the WTI futures contract at Cushing. From there, you layer on two more numbers to land on a Midland physical price.
- Start with the Nymex CMA for the relevant trade month.
- Add the Argus diff to CMA, which converts the futures-based CMA into a prompt physical price.
- Add the Argus WTI Midland differential, which captures the location and quality spread between Midland and Cushing.
- Apply the trade-month averaging window to smooth daily noise into a single settlement value.
That third step is the one most people skip when they try to eyeball their own math. Argus does not publish one number and call it done. It runs a weighted average across the determination period for the trade month, which is the same averaging window that ICE’s cash-settled contracts reference for final settlement.
Using the diff-to-CMA step matters because it corrects for contango or backwardation in the futures curve. Skip it, and you are pricing physical barrels off a futures curve shape that has nothing to do with what a Midland buyer actually pays you that month. That is a common way operators end up arguing with their crude purchaser over a check that should never have been in dispute.
Instruments Operators Use to Hedge Midland Exposure
Cushing-based Nymex futures remain the most liquid contract in the world, but liquidity does not equal accuracy for a Permian producer. If your barrels sell off a Midland-quality contract and you hedge purely on Cushing WTI, you are carrying basis risk you may not even be tracking.
A handful of instruments were built specifically to close that gap:
- ICE Midland WTI (HOU): A Gulf Coast deliverable contract that prices and settles Midland-quality barrels with delivery into MEH or ECHO terminals, giving operators a way to hedge that actually matches their physical grade.
- ICE and CME trade-month diff futures: Cash-settled contracts tied to the Argus WTI Midland differential, letting a producer lock in the basis itself rather than the outright price.
- CME calendar spread and diff swaps: Products that let you trade the WTI Midland (Argus) versus WTI relationship directly, without taking on outright price exposure.
The delivery mechanics differ in a way that trips up operators new to hedging. The ICE HOU contract can involve physical delivery obligations at the Gulf Coast, while the trade-month diff futures settle in cash against the Argus assessment. Since the pipeline buildout of the past several years narrowed the historical Midland discount toward parity or even a premium in some months, more producers now treat the diff contracts as a standalone hedge rather than an afterthought bolted onto a Cushing position.
If your exposure is genuinely at Midland, a Midland-referenced instrument reduces basis risk. If you are only hedging a Cushing-settled Nymex position, you are still exposed to whatever the diff does, whether you tracked it or not.
What Actually Moves the Spread
The single biggest driver of the Midland-Cushing spread over the past decade has been takeaway capacity, plain and simple. Before 2019, Midland crude regularly traded $10 to $20 a barrel below Cushing because there was more oil coming out of the ground than pipe to move it. Cactus II, EPIC, and Gray Oak changed that picture by adding enough capacity to relieve the bottleneck, and the spread compressed toward parity, occasionally flipping to a premium when Gulf Coast export demand pulled hard on Midland barrels specifically.
Watch these factors if you want to anticipate a move rather than react to it:
- Reported pipeline utilization rates out of the Permian
- Cushing inventory levels reported weekly by the EIA
- Gulf Coast export volumes and tanker loading schedules
- Planned or unplanned pipeline maintenance and outages
- Winter weather events that can freeze off production or disrupt terminal operations
Seasonal effects are real but smaller than infrastructure effects. A hard freeze can knock production offline for days and tighten local supply, temporarily pushing Midland pricing stronger relative to Cushing. That is a short-term blip. A new pipeline coming online is a structural shift that can hold for years.
Pro Tip: Don’t anchor your forecast to the old $15 to $20 discount that dominated pre-2019 headlines. That number reflected a pipeline-constrained basin that no longer exists in the same form. Build your forecast off the last 12 to 18 months of actual settlement data instead.
Turning the Differential Into a Realized Price You Can Book
Here’s the part that actually hits your bank account. Realized wellhead price is not the number a business news ticker shows you. It’s a calculation: benchmark price, adjusted for the differential, adjusted again for transport and quality deductions written into your specific sales contract. When Midland trades at a premium, transport can function almost like an addition rather than a straight deduction, because your buyer is paying up for barrels that are already positioned close to export infrastructure.
A simple worked path looks like this:
- Pull the Nymex CMA for the sales month.
- Add the Argus diff to CMA to get a Cushing physical price.
- Add the Argus WTI Midland differential to get a Midland physical benchmark.
- Subtract transport costs and any quality deductions specified in your purchase contract.
- Compare that number against what your buyer actually paid you.
That last step is where most reconciliation errors get caught. Cross-check every settlement against your field work tickets and delivery receipts before you post it to the well cost book, not after.
| Hedge checklist item | Why it matters |
|---|---|
| Match instrument to exposure (Midland vs. Cushing) | Reduces basis risk if your barrels sell off Midland pricing |
| Set monitoring cadence to the trade-month window | Catches mispricing before settlement locks in |
| Reconcile Argus diffs against buyer statements monthly | Flags contract deductions that don’t match published data |
| Track pipeline and Cushing storage news | Anticipates moves before they hit your check |
How WellsManager Keeps the Differential From Slipping Through the Cracks
Most operators find out their realized price was off after the check clears, not before. A live commodity price feed tied to your per-well ledger changes that timing. When you can see the Argus differential and your realized price side by side against a specific well, the gap between what you expected and what got paid shows up immediately instead of at month-end close.
That same data flows straight into investor distributions, so partners aren’t waiting on a manual spreadsheet reconciliation before they get paid. Wellsmanager pairs that pricing view with:
- Field work tickets that log transport and quality deductions against actual invoices, not memory
- A per-well cost book that ties commodity pricing directly to well-level economics
- A commodity price dashboard built around live pricing rather than a monthly PDF from your purchaser
How Volatile Has the Spread Really Been?
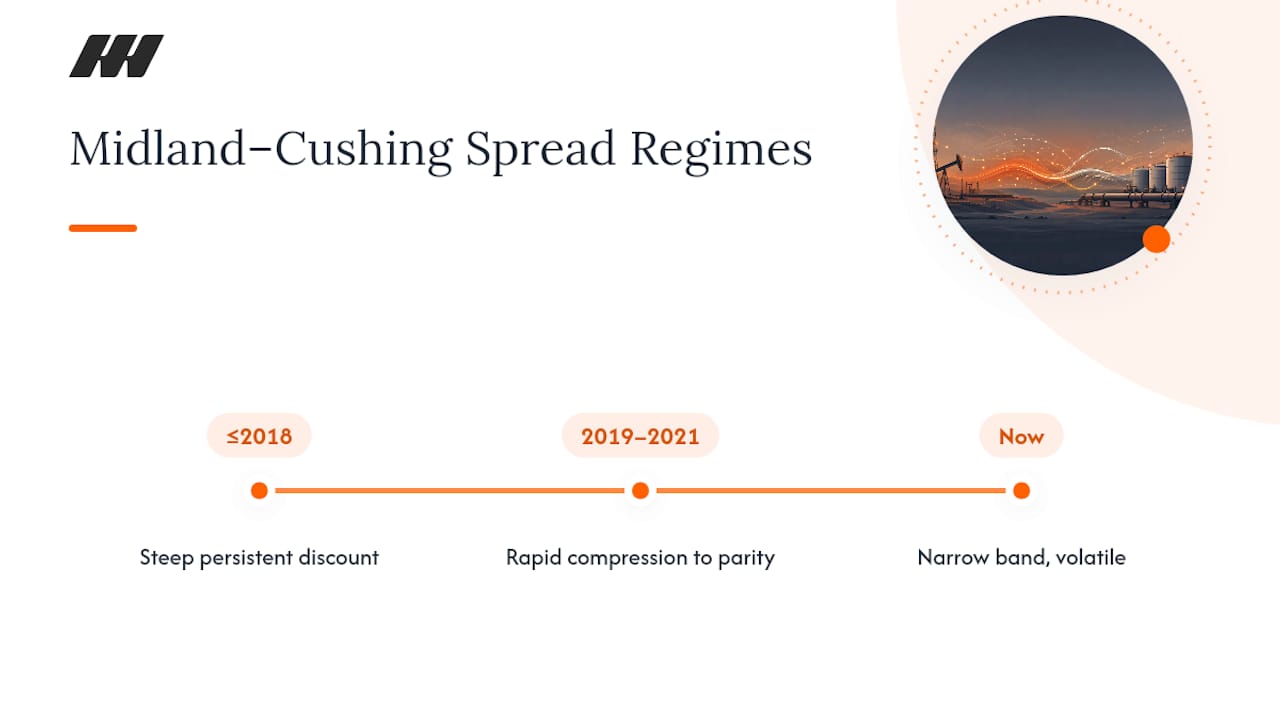
The Midland-Cushing spread has swung through three distinct regimes since Permian production ramped up. Phase one, roughly through 2018, was defined by chronic pipeline shortage. Midland crude sat at a steep, persistent discount because there was no way to get all the oil out of the basin, and the spread widened sharply during any drilling surge.
Phase two arrived with the pipeline wave: Cactus II, Gray Oak, and EPIC all came online within roughly a two-year window and relieved the bottleneck fast. The spread compressed hard, moving from double-digit discounts toward near parity in a matter of months rather than years, which is unusually fast for infrastructure-driven pricing shifts.
Phase three is the one operators live in now: a spread that can flip between a modest discount and a modest premium depending on export demand, storage levels, and short-term disruptions, without ever returning to the extreme discounts of the pre-pipeline era. Volatility within that band is driven less by chronic shortage and more by short, sharp events. A single pipeline outage or a Gulf Coast weather event can move the spread noticeably within a week, then settle back once the disruption clears.
The practical lesson is that the level of the spread has stabilized in a narrower range, but the day-to-day variance around that range hasn’t necessarily gone down. That distinction changes how you should model the differential in a forecast versus how you’d model it for a hedge.
Where Mid-Cush Sits Next to Other Regional Spreads
Midland-Cushing is not the only basis differential that affects a Permian operator’s economics, and comparing it against others helps put the size of the move in context. The Cushing to Gulf Coast spread reflects the cost of moving Cushing barrels to export terminals, and it tends to move more slowly than Mid-Cush because Cushing has decades of established pipe connecting it to the coast.
The Midland to Gulf Coast spread, by contrast, behaves more like a hybrid of the two: it captures both the wellhead-to-Cushing basis and the Cushing-to-coast basis in a single number, which is why traders watching export economics often quote it directly instead of stacking two separate differentials. Compared to differentials in other basins, like the Bakken’s basis to Cushing or WTI’s basis to Louisiana Light Sweet, Mid-Cush has generally been more liquid and more closely tracked because Permian volumes dwarf most other onshore basins.
The practical point for an operator is this: Mid-Cush is usually the tightest and most actively quoted of the group, which means published Argus and ICE data for it is more reliable day to day than thinner regional benchmarks. If you are cross-checking a buyer’s deduction against a public number, Mid-Cush is one of the easier spreads to verify in real time.
Pipeline Approvals and Tariff Rules That Move the Spread
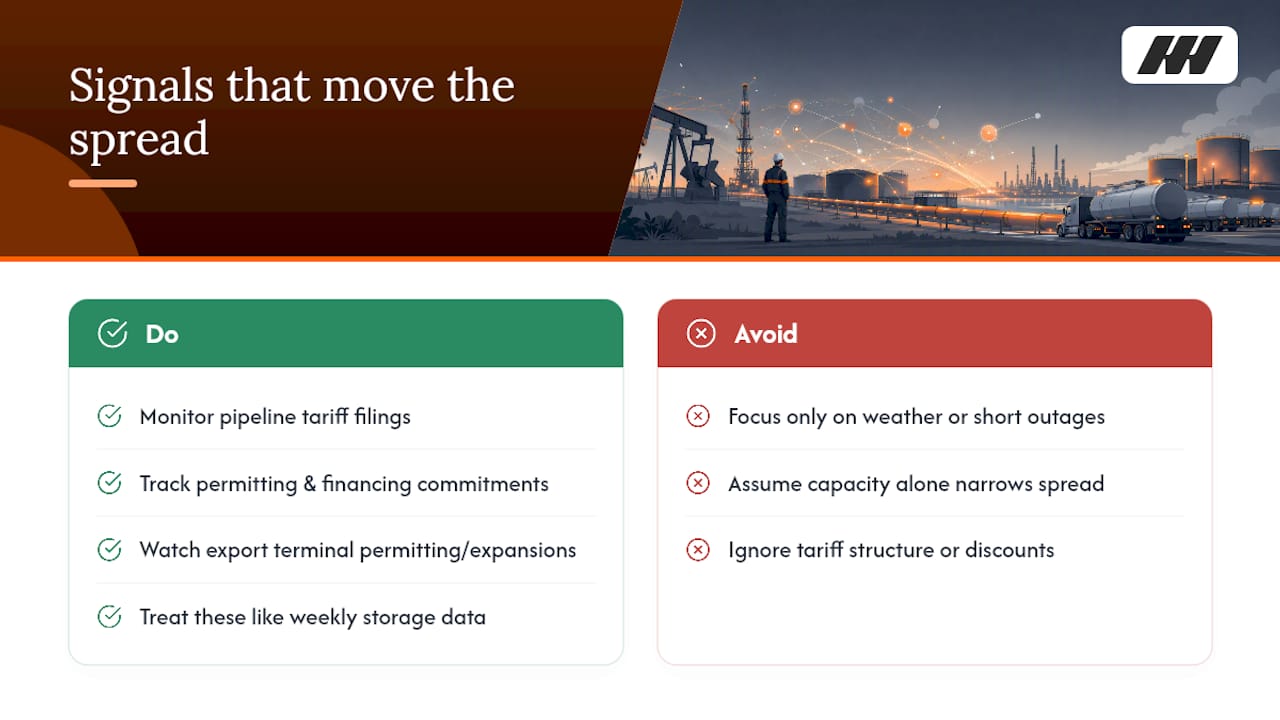
Every major shift in the Midland-Cushing differential over the past decade traces back to a regulatory or permitting decision somewhere upstream of the price itself. New pipeline capacity doesn’t appear overnight. It goes through a permitting process, financing commitments, and often a Federal Energy Regulatory Commission tariff filing before a single barrel moves, and each stage introduces uncertainty into how the market prices future basis.
Tariff structure matters just as much as capacity. A pipeline can have plenty of room and still push the differential wider if its tariff is expensive relative to alternatives, because shippers factor that cost directly into what they’re willing to pay for Midland barrels versus Cushing barrels. When a new line files a discounted tariff to win volume commitments, it can compress the differential faster than the physical capacity increase alone would suggest.
Export policy plays a role too, though indirectly. Gulf Coast terminal expansions and permitting timelines for new export docks affect how much demand pulls on Midland crude specifically, since Midland-quality barrels are the ones most often blended for export cargoes. An operator tracking the differential should watch pipeline tariff filings and export terminal permitting news the same way they watch weekly storage data, because both move the spread on a longer lag than weather or short-term outages, but the moves tend to be larger and stickier once they land.
Storage Limits at Cushing and Midland That Squeeze the Spread
Storage capacity acts like a pressure valve on the differential, and when that valve gets tight at either end, the spread reacts fast. Cushing has long served as the flexible storage point for the entire WTI market, and when Cushing inventories climb toward tank-top levels, Cushing pricing tends to weaken relative to Midland, because there’s nowhere left to put incremental barrels arriving at the hub.
Midland has less storage flexibility than Cushing by design; it was built as a gathering and transport point rather than a long-term storage hub. That means when pipeline capacity out of the Permian gets constrained, even temporarily, Midland storage fills faster and the local discount can widen quickly until either pipe capacity frees up or storage gets built out further.
The two constraints interact. A Cushing storage squeeze can actually help Midland pricing by making Cushing look relatively oversupplied, while a Midland-side storage or pipeline squeeze does the opposite, widening the discount because barrels have nowhere to go but into tanks that are already filling up. Operators who watch only one side of that equation are missing half the picture. The practical takeaway: weekly storage data out of Cushing is one of the more useful leading indicators for anticipating a near-term move in the differential, even though the story often actually originates on the Midland side of the basin.
Real Examples of the Spread Blowing Out and Snapping Back
The clearest illustration of infrastructure driving price came in the years leading up to 2019, when Midland crude traded at discounts of $10 to $20 a barrel below Cushing during periods of peak drilling activity. Production was growing faster than any pipeline company could build capacity, and the discount widened every time completion crews ramped activity in the basin, then narrowed slightly whenever drilling paused.
The turnaround illustrates the flip side just as clearly. As Cactus II, Gray Oak, and EPIC came online in sequence, each addition relieved pressure on the basin’s takeaway bottleneck, and the discount compressed sharply rather than gradually. Operators who had locked in hedges based on the old wide-discount assumption found themselves on the wrong side of a basis move that ran the opposite direction from what they’d modeled just months earlier.
More recent volatility tends to be shorter and sharper rather than structural. A pipeline outage, whether planned maintenance or an unplanned shutdown, can widen the spread for days to weeks until flows normalize. Winter weather events that freeze off Permian production temporarily tighten local supply, which can push Midland pricing stronger relative to Cushing for a brief window before reverting once wells come back online. None of these recent moves have approached the scale of the pre-2019 discount, but they are frequent enough that an operator checking pricing only once a month will miss most of them entirely.
Common Mid-Cush Mistakes and the One Fix That Pays Off Fastest
The most expensive mistake I see is operators still budgeting off the old double-digit Midland discount, years after pipeline capacity closed most of that gap. The second is treating settlement as a single number instead of a trade-month average, then arguing with a buyer over a “discrepancy” that was never a discrepancy at all.
The fix that pays off fastest isn’t complicated: add a recurring Mid-Cush check to your well cost book workflow, tied to the same cadence as your commodity dashboard review. Do it monthly at minimum, weekly if you’re actively hedging.
— Pedro
Get the Differential Out of Your Head and Into Your Well Cost Book
Wellsmanager turns the math in this article into a number you can actually see against each well, not something you reconstruct from a purchaser’s PDF three weeks after the fact. The commodity dashboard tracks live pricing against your per-well ledger, so a swing in the Midland differential shows up as a change in realized revenue before your investor checks go out, not after. Field work tickets tie transport and quality deductions to real invoices instead of a note in a spreadsheet, and the same data feeds directly into your lease operating statement and investor distributions.
If you’re still reconciling settlements by hand every month, that’s the workflow worth fixing first. Visit Wellsmanager to see how the platform ties commodity pricing to your well cost book and investor checks in one place.
FAQ
What is the difference between WTI and WTI Midland?
WTI refers to the benchmark grade priced at Cushing, Oklahoma, while WTI Midland is a distinct physical grade delivered at Midland, Texas, typically running 41 to 43.5 degrees API with about 0.20% sulfur. The price gap between the two is the Midland-Cushing differential.
What is the current price relationship between Midland and Cushing WTI?
The relationship has moved from wide historical discounts of $10 to $20 a barrel before major pipeline capacity came online, toward a narrower band that can sit near parity or shift to a modest premium depending on export demand and storage levels. Check the Argus WTI Midland differential assessment for the current trade-month value rather than relying on older averages.
Why does WTI at Cushing often trade cheaper than Brent Crude?
Brent reflects seaborne, internationally traded crude with easier access to global refining markets, while Cushing WTI is landlocked and historically depended on pipeline capacity to reach export terminals. That structural difference in market access, not crude quality alone, has driven much of the persistent WTI to Brent discount.
Does the United States export crude oil, including WTI grades?
Yes. The United States lifted its crude export ban several years ago, and Gulf Coast terminals now regularly load both Midland-quality WTI and Cushing-sourced barrels for international buyers. Export demand from those terminals is one of the direct drivers of the Midland-Cushing differential discussed earlier in this article.
How do I track the Midland-Cushing differential for my own wells?
Pair a live commodity price feed with your per-well cost records so realized price changes show up as soon as the differential moves, rather than weeks later. Wellsmanager’s commodity price dashboard is built for exactly that kind of ongoing check against your well cost book.