Commodity Price Dashboard for Upstream Oil & Gas Operators

For upstream operators, the best commodity price dashboard is one that lives inside your operations platform, not on a separate market terminal. Wellsmanager delivers exactly that: live price feeds wired directly to per-well P&L, lease operating statements, and exception-filtered surveillance, so your finance team sees revenue impact in real time rather than at quarter-end. Field deployments of AI-based IOCaaS have demonstrated surveillance efficiency gains when exception-based dashboards focus engineer attention on wells that actually need it. That figure is the business case in one line.
Table of Contents
- Why a live commodity price dashboard changes upstream operations
- What features does a commodity price dashboard need for per-well economics?
- Integration and implementation checklist for IT, finance, and operations
- Security, auditability, and compliance checks before enabling live price-driven P&L
- How to quantify ROI from an embedded commodity price dashboard
- How Wellsmanager implements an embedded commodity price dashboard
- Vendor and IT questions to validate before you buy or enable a dashboard
- Key Takeaways
- What teams actually get wrong when rolling out a price dashboard
- Wellsmanager gives you per-well revenue visibility from day one
- Useful sources for implementation and ROI validation
Why a live commodity price dashboard changes upstream operations
The gap between a price move and your response to it is where money leaks. When WTI drops $8 overnight, a finance team running monthly spreadsheets won’t see the per-well impact until the next variance report. By then, uneconomic wells have been producing at a loss, capital decisions have been delayed, and the LOE conversation is already two weeks stale.

Finance officers are direct about this: instant visualization of price moves against well-level economics is the difference between active portfolio management and reacting to quarterly variances. That is not a preference; it is a structural advantage.
Real-time price visibility changes three things operationally:
- Per-well revenue and netbacks recalculate continuously, so you know which wells cover lifting costs at the current price and which don’t.
- Cashflow forecasting tightens because realized prices feed forward into invoice projections rather than waiting for month-end reconciliation.
- Capital decisions accelerate. When you can stress-test a $5/bbl price shock across your entire portfolio in minutes, the operating committee gets ranked actions, not a spreadsheet to interpret.
The same IOCaaS field pilots that showed 30% surveillance efficiency gains also recorded an approximately 5% reduction in lease operating expenses in the first year following deployment. That LOE delta, multiplied across a multi-well portfolio, funds the platform cost many times over.
What features does a commodity price dashboard need for per-well economics?
Not every price feed qualifies as an operational tool. A dashboard built for traders shows futures curves and index spreads. A dashboard built for upstream operators does something harder: it maps live prices to individual well economics, accounting for differentials, contract terms, and activity-based costs. The features that separate the two are specific.
- Timestamped price feeds with configurable sources. You need to choose your price deck (WTI strip, flat, custom differential) and see exactly when each price was ingested. Provenance matters for audit and reconciliation.
- Per-well P&L with activity-based costing inputs. Fuel usage, compressor runtime, and chemical injection frequency produce more accurate per-well economics than smoothed G&A allocations. The dashboard must accept those inputs, not just barrel counts.
- Exception filters and threshold alerts. When a well crosses below its economic breakeven at the current price, the system should flag it automatically. This is what scales engineer capacity without adding headcount.
- Audit trails and role-based access controls. Finance, commercial, and operations teams need different views, and every price change or P&L adjustment needs a logged record of who changed what and when.
- Secure APIs for GL and production-accounting reconciliation. The price dashboard is only as useful as its ability to push verified data downstream to your general ledger and production-accounting system.
- Configurable stress-testing. Integrated dashboards used for breakeven analysis become strategic inputs for capital allocation, not just budget-variance tools. That requires built-in what-if scenarios, not a separate spreadsheet.
Integration and implementation checklist for IT, finance, and operations
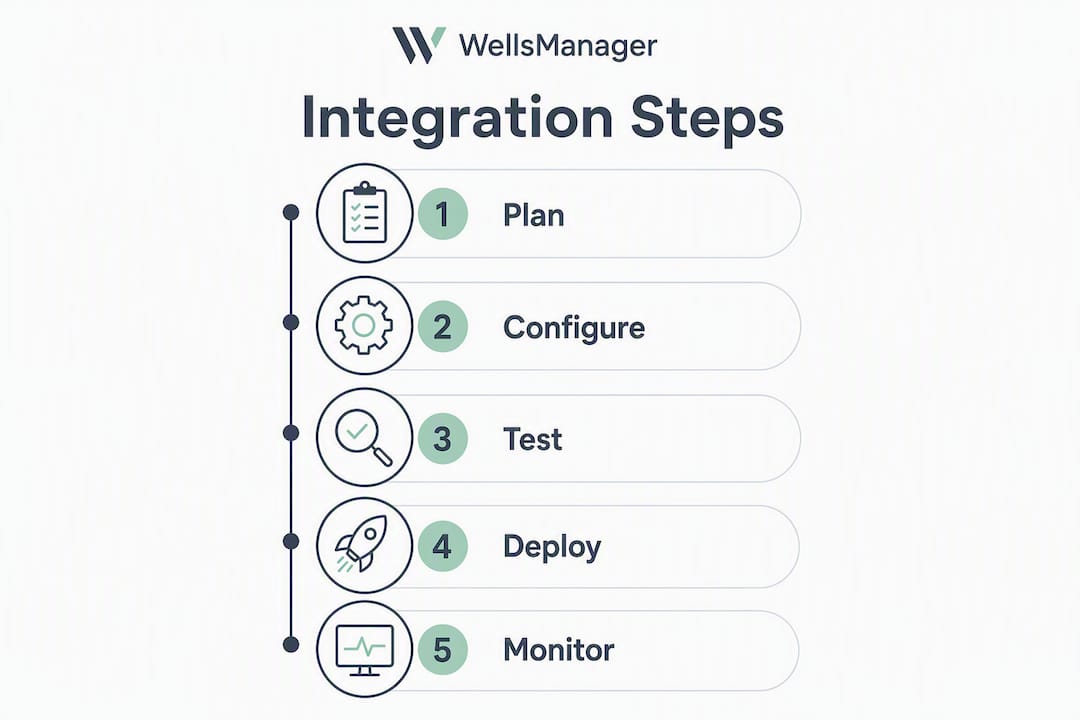
Getting from decision to deployment without surprises requires mapping your data sources before you touch the software. Here is a practical sequence:
- Map your data sources. Identify your SCADA historian (PI, Cygnet, Inductive Automation, or FactoryTalk), your production-accounting system, your GL, and your marketing/realization contracts. Each one feeds the dashboard differently, and gaps here cause reconciliation failures later.
- Define latency requirements. Decide whether you need hourly price updates or daily feeds. Hourly feeds suit active surveillance; daily feeds are sufficient for LOE reporting. Document the reconciliation window for each data stream and require timestamps on every ingested value.
- Confirm API contracts and differential handling. Your price-feed provider needs a documented API schema. Differential handling (basis, quality, transportation) must be configurable per well or per field, not hardcoded.
- Run a sandbox with historical replay. Before going live, load 12 months of historical production and price data and replay a known price shock. Verify that per-well P&Ls match your existing spreadsheet calculations within an acceptable tolerance.
- Run parallel validation. Operate the dashboard alongside your current spreadsheets for 30–60 days. Finance sign-off should require reconciliation of at least one full month’s LOE and revenue figures before decommissioning the old process.
- Embed the dashboard in daily workflows. Post a screen in the ops room. Include the price-driven exception list in the morning surveillance meeting. The tool only changes behavior if people see it every day.
A SaaS architecture simplifies steps 1–3 considerably, since the vendor manages infrastructure, update cycles, and integration connectors rather than your IT team.
Pro Tip: Lock your initial price deck to a single configurable source during the parallel-run phase. Adding multiple differential layers before the base reconciliation is validated is the most common cause of sign-off delays.
Security, auditability, and compliance checks before enabling live price-driven P&L
Finance and auditors will ask four questions about any live price system. Answer them before go-live, not after.
Before enabling a live price-driven P&L, confirm that every price change, manual override, and P&L adjustment is logged with a user ID, timestamp, and reason code. Without that record, the dashboard’s outputs are not defensible in an audit or a royalty dispute.
- Tamper-evident audit trails. Every price change and P&L adjustment must log user ID, timestamp, and reason. This is non-negotiable for royalty reporting and tax purposes.
- Role-based access controls. Finance sees revenue and P&L. Operations sees production and exception alerts. Commercial sees contract and differential data. Mixing those views creates both a security risk and a compliance exposure.
- Authenticated APIs with SLA-backed provenance. Your price-feed provider should document the source of each price, the latency SLA, and the process for correcting erroneous values. An undocumented feed is an audit liability.
- Retention and export policies. Audit teams need to replay historical calculations. Confirm that the platform retains raw price inputs, allocation logic, and outputs for the retention period your tax and reporting obligations require. The invoice approval workflow connecting operations to finance depends on this same data chain.
How to quantify ROI from an embedded commodity price dashboard
A business case for procurement needs numbers, not narratives. The ROI calculation has three inputs: surveillance efficiency, LOE improvement, and prevented deferred production.
| ROI Input | Baseline Metric | Expected Improvement | Value Driver |
|---|---|---|---|
| Surveillance efficiency | Engineer-hours per well per month | Reduction | More wells monitored per engineer |
| Lease operating expenses | LOE per BOE (current) | Reduction | Automation, fewer callouts |
| Deferred production prevented | Avg. downtime hours per well | Varies by field | Faster exception response |
| Decision cycle time | Days from price move to action | Significant reduction | Real-time visibility |
To build a conservative case: take your current surveillance-hours per engineer, apply up to a 30% efficiency gain, and calculate the equivalent wells-per-engineer increase. Then apply a 5% LOE reduction to your total annual LOE spend. For a 50-well portfolio spending $2M annually on LOE, that 5% improvement alone represents $100,000 per year.
Activity-based costing sharpens this further. When the dashboard captures fuel, compressor runtime, and chemical costs at the well level rather than allocating them as blended G&A, you identify cost outliers that monthly accounting hides entirely.
Post-deployment KPIs to track: wells monitored per engineer per day, LOE per barrel by field, time-to-decision on price-driven production changes, and cashflow forecast variance versus actual.
How Wellsmanager implements an embedded commodity price dashboard
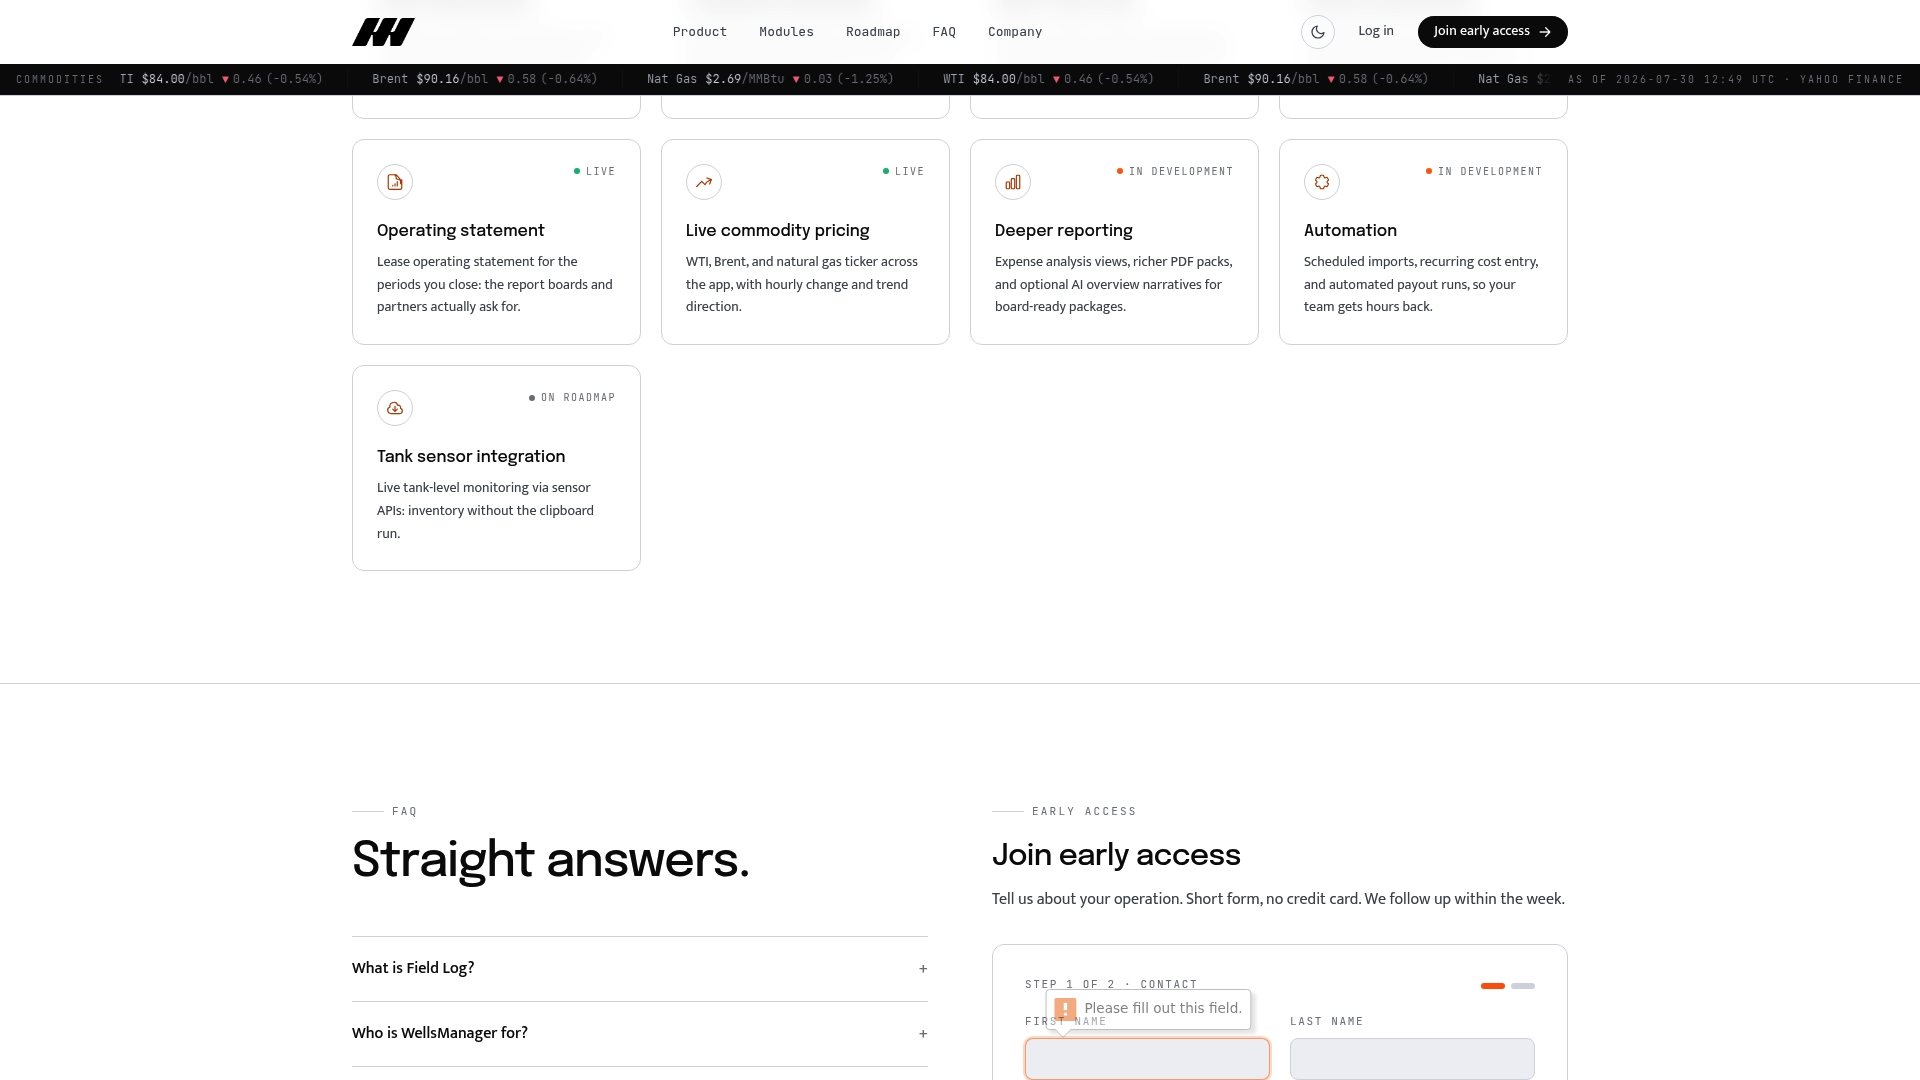
Wellsmanager maps every feature from the checklist above to a specific module inside its upstream operations platform, rather than requiring a separate market data subscription.
| Feature | Wellsmanager Implementation |
|---|---|
| Live price ingestion | Configurable price feeds with timestamps and differential handling per well |
| Per-well P&L | Activity-based costing inputs mapped to individual well economics |
| Exception filters | Threshold-based alerts surfaced in the surveillance module |
| Audit trails | Tamper-evident logs for all price changes and P&L adjustments |
| Role-based access | Separate finance, operations, and commercial views |
| AI executive briefs | Automated summaries of price-driven P&L changes for rapid decisioning |
The integration path follows the single source of truth approach: production data, operating costs, and live prices converge in one platform rather than being reconciled across three separate systems. SCADA historian connectors, production-accounting reconciliation, GL export, and marketing realization links are all handled within the platform.
Operators who embed the price dashboard inside Wellsmanager rather than running a standalone market terminal avoid the most common failure mode: a price feed that updates in one system while the per-well P&L sits frozen in a spreadsheet somewhere else.
- Per-well revenue recalculates automatically when prices update.
- Exception-filtered alerts surface uneconomic wells without manual review.
- AI-generated executive briefs summarize price-driven P&L shifts for the operating committee.
- Audit trails cover the full data chain from price ingestion to LOE reporting.
Vendor and IT questions to validate before you buy or enable a dashboard
Use this list in demos and RFPs. Any vendor who can’t answer these clearly is not ready for production deployment.
- What is the source of each price feed, and how is an erroneous value corrected and logged?
- Can differentials be configured at the well or field level, and are they versioned with timestamps?
- What is the API latency SLA, and what happens to the P&L display during a feed outage?
- Can you export the full audit trail, including price inputs and allocation logic, in a format your auditors can read?
- Does the sandbox environment support historical price replay for reconciliation testing?
- How are role-based access controls documented, and can they be configured without vendor involvement?
- Can the system reconcile a known price shock across per-well P&Ls and lease operating statements in a test environment before go-live?
Key Takeaways
An embedded live commodity price dashboard, not a standalone market terminal, is the only architecture that delivers per-well P&L accuracy and audit-ready outputs for upstream operators.
| Point | Details |
|---|---|
| Embed, don’t bolt on | A price feed inside your ops platform updates per-well P&L automatically; a standalone terminal doesn’t. |
| Exception filters scale capacity | Up to 30% surveillance efficiency gains come from focusing engineers on flagged wells, not all wells. |
| LOE improvement funds the platform | A ~5% LOE reduction on a $2M annual spend returns $100,000 per year, covering platform costs. |
| Audit trails are non-negotiable | Every price change and P&L adjustment must log user, timestamp, and reason before finance can rely on outputs. |
| Wellsmanager covers the full checklist | Live price ingestion, per-well P&L, exception filters, audit trails, and AI briefs are all native to the platform. |
What teams actually get wrong when rolling out a price dashboard
The technical integration is rarely where rollouts fail. The failure usually happens one step earlier: operators assemble per-well models manually, update them after major price moves only when someone remembers to, and then wonder why the dashboard and the spreadsheet disagree.
Per-well modeling requires continuous assembly of production history, operating cost streams, differentials, and contract terms. A manual spreadsheet approach breaks down precisely when you need it most: after a sharp price move. The dashboard only fixes this if it is the system of record, not a second opinion.
My practical advice: start with a pilot field of 10–15 wells. Lock one price deck. Run the parallel validation for a full month before expanding. The cultural shift matters as much as the technical one. Put the exception-alert screen in the ops room where the morning meeting happens. When engineers start their day by looking at which wells crossed the economic threshold overnight, the tool becomes habit rather than homework.
The other pitfall is missing timestamps on price inputs. An undated price in a P&L is not just an audit problem; it makes reconciliation against your marketing statement nearly impossible. Require timestamped provenance from day one, and build that requirement into your vendor contract before signing.
Wellsmanager gives you per-well revenue visibility from day one
Per-well P&L accuracy at live commodity prices is what separates operators who manage their portfolio from those who report on it after the fact. Wellsmanager delivers live price ingestion, activity-based per-well economics, exception-filtered surveillance, tamper-evident audit trails, and AI-generated executive briefs in a single upstream operations platform, with no separate market terminal required.
Bring a sample production history, a GL extract from the last quarter, and one price shock scenario you want to stress-test. Wellsmanager’s team will walk through exactly how the platform maps your data to per-well P&L and what the exception alerts would have flagged. Request access to schedule a working demo, or visit wellsmanager.com to review the full platform.
Useful sources for implementation and ROI validation
- Case Study: Field Deployments of AI-Based IOCaaS Advancing Artificial Lift and Flow Assurance — SPE/JPT field pilot data on surveillance efficiency and LOE improvements from exception-based dashboards.
- How to Use AI for Oil and Gas — Sirca Honeycomb write-up on per-well modeling requirements and the limits of manual spreadsheet approaches.
- Financial Analytics for Oil Industry — Covers LOE per barrel, strip-price sensitivity, and how dashboards become capital-allocation tools.
- Real-Time KPIs Beat Month-Late Reports — Wisdom at the Wellhead on activity-based costing and why smoothed monthly accounting misses per-well cost differences.
- The True Value of SaaS in Oil and Gas — Accruent on SaaS architecture advantages for real-time operational analytics.
Operators who treat their commodity price dashboard as a standalone reporting tool will always be a step behind those who wire it directly into per-well economics and daily surveillance workflows.