Equipment Downtime Tracking: A Field-to-Finance Playbook

A compliant, per-well equipment downtime tracking system must deliver three things simultaneously: automated detection tied to telemetry, timestamped audit trails, and per-well P&L impact so operations and finance can act on the same data the same day. Anything short of that creates two ledgers, and two ledgers mean disputes at month-end close.
The fastest path to reliable tracking combines a rule-based downtime detector with structured field confirmation and cost allocation at the point of capture. ExxonMobil’s Downtime Advisory System (DTAS), deployed across roughly 2,500 Permian wells, demonstrates what that looks like at scale: rules-based algorithms cross-validate telemetry signals, flag non-producing or underperforming wells daily, and route each event through an operator approve/reject step before the record is finalized. Wellsmanager delivers the same field-to-finance architecture for independent operators, with per-well P&L, immutable audit trails, and AI-generated executive briefs built into a single SaaS platform.
Start here:
- Baseline telemetry and well tests for every asset before writing detection rules.
- Define your sub-asset hierarchy by failure mode (not accounting code) so events map to causes.
- Enable an approve/reject workflow so automated triggers require field confirmation before they become audit records.
Table of Contents
- What does a downtime tracking system have to produce for ops and finance?
- Which data sources and detection methods actually work?
- How should you structure assets and failure modes?
- How do you log downtime events from field to finance?
- How do you turn downtime events into per-well financial impact?
- What integrations and compliance outputs do you need?
- What does a phased rollout look like?
- How do you evaluate and choose the right solution?
- Wellsmanager gives you the full field-to-finance stack
- Key Takeaways
- The part most operators underestimate
- Useful sources
What does a downtime tracking system have to produce for ops and finance?
The KPIs that matter fall into three buckets: operational availability, reliability, and financial impact. A system that only tracks one of the three forces someone to reconcile the rest manually.
- Availability % and uptime hours per well, per pad, per basin, updated at least daily.
- MTTR (mean time to repair) and MTBF (mean time between failures) by sub-asset, so reliability trends are visible before a failure pattern becomes a production crisis.
- Classified downtime categories: planned maintenance, unplanned mechanical failure, inferred shut-in, and underperformance (liquid loading, gas-lift falloff, choke events). Each category carries a volume impact in barrels of oil or MCF so production allocation is defensible.
- Per-well P&L impact: lost revenue from deferred production, direct maintenance expense during the outage, and a clear flag for whether the repair is capitalized or expensed.
- Audit outputs: immutable timestamps, event provenance linking telemetry snapshots to field confirmations, and a custody log showing who approved or rejected each event and when.
DTAS-style systems surface previously invisible losses, including liquid loading and gas-lift underperformance, that manual logs routinely miss. Those recovered volumes go straight to the top of the priority list for restoration.
Which data sources and detection methods actually work?

Essential inputs
Every detection method is only as good as the signals feeding it. The minimum viable data set for upstream asset monitoring includes:
- SCADA/RTU telemetry: flow rate, tubing and casing pressure, ESP motor current, downhole gauges.
- Well test baselines: the reference production rate each detection rule compares against.
- ESD and alarm logs: distinguish emergency shutdowns from gradual underperformance.
- Vendor tickets and work orders: link mechanical events to field activity.
- Field jobcards and manual confirmations: the human layer that validates or overrides automated flags.
Detection methods compared
| Data source | Detection role | Typical failure signals |
|---|---|---|
| SCADA/RTU telemetry | Primary automated trigger | Flow dropout, pressure deviation, ESP current spike or loss |
| Well test baseline | Threshold calibration | Sustained underperformance vs. expected rate |
| ESD/alarm logs | Event classification | Emergency shutdown vs. inferred shut-in |
| Vendor tickets | Root-cause linkage | Mechanical failure confirmation, part replacement |
| Field jobcards | Operator validation | Approve/reject automated flag, add context |
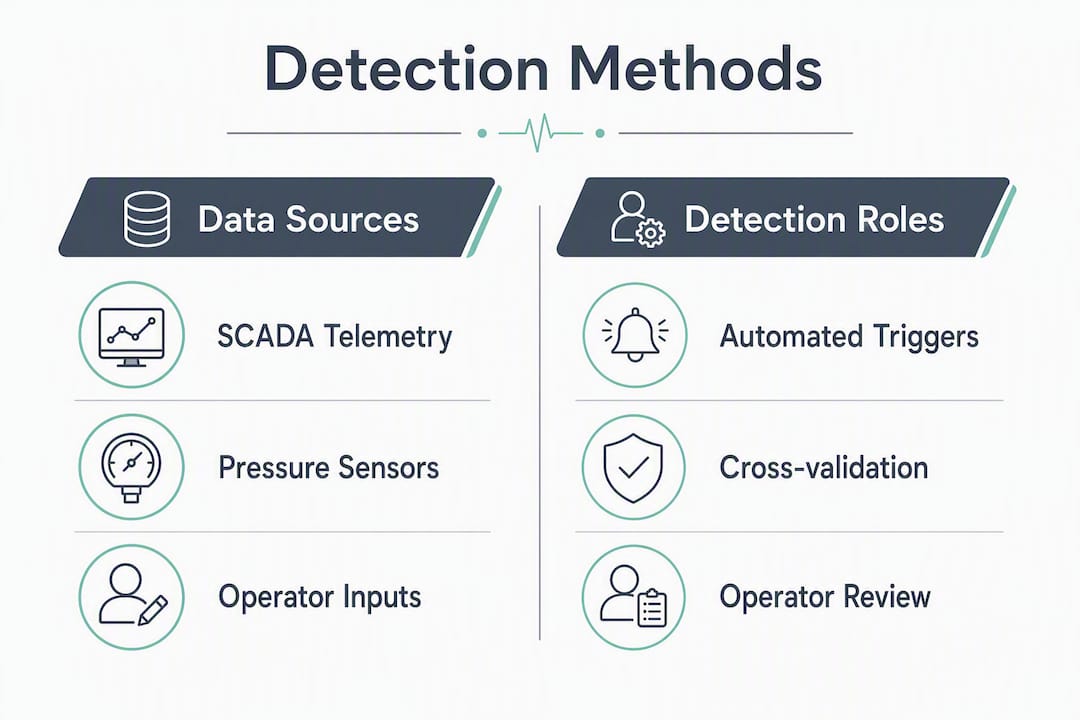
Rules-based algorithms (threshold crossings, inferred shut-in logic) are fast and auditable but generate false positives on noisy sensors. Statistical or ML-based anomaly detection catches subtler degradation patterns but requires clean historical data and more calibration time. Most production environments benefit from a hybrid: rules-based triggers for speed, anomaly detection for early warning on critical equipment.
Cross-validation across multiple signals is what separates a trustworthy system from one that cries wolf. DTAS, for example, cross-validates ESD logs, ESP current, and downhole pressure before classifying an event, which cuts false positives and keeps operators from ignoring alerts.
Pro Tip: When telemetry is noisy, validate flow-rate dropout against a second signal (casing pressure or ESP current) before triggering a downtime flag. A single-signal rule on a faulty transducer will erode field trust within weeks.
The approve/reject step is not optional. Field adoption collapses when automated triggers are forced without operator review. Ruggedized tablets running structured digital forms, similar to PTTEP’s Digital Jobcard program, give crews a fast, standardized way to confirm or reject a flag at the wellsite rather than correcting records retroactively in the office.
How should you structure assets and failure modes?
The most common mistake in asset hierarchy design is building it to match the chart of accounts. That produces clean GL codes and useless reliability data.
Structure assets by how they fail, not by how they are owned. An ESP well breaks down as: wellbore → ESP motor → pump stages → seals → cable. A compressor breaks down as: unit → stages → bearings → seals → control valve. When a downtime event is logged at the sub-asset level, MTBF and MTTR calculations become meaningful. When it is logged at the well level, all you know is that something failed somewhere.
- Map each sub-asset to a serialized asset ID so events retain continuity across equipment swaps and lifecycle changes.
- Use attribute mapping to distinguish true component failures from downstream symptoms or reservoir-driven effects. A pressure drop at the wellhead is not the same failure mode as a pressure drop caused by a failed ESP seal.
- Tag every event with a failure mode code drawn from your FMEA library. RCM and FMEA-driven strategies shift unnecessary time-based tasks to condition-based monitoring, which reduces unplanned downtime and maintenance cost.
Pro Tip: Build the asset hierarchy in your CMMS first, then mirror it in your downtime tracking system. If the two registries use different asset IDs, every integration becomes a manual reconciliation exercise.
How do you log downtime events from field to finance?
Every event record needs a minimum set of fields to be defensible in an operations review or a regulatory audit:
- Asset ID and sub-asset ID.
- Start timestamp and end timestamp (or an “ongoing” flag if the event is still active).
- Detection method (automated rule, anomaly alert, or manual entry).
- Evidence links: telemetry snapshot reference, jobcard ID, vendor ticket number.
- Approver ID and approval timestamp.
The workflow runs in one direction: automated trigger → operator review on a ruggedized device → approve or reject with a note → final immutable record. No editing after approval without a documented change reason and a second approver.
| Timestamp source | Verification priority | Notes |
|---|---|---|
| SCADA system clock | Highest | Synchronized to GPS or NTP; use as event start reference |
| Field device timestamp | High | Acceptable if device is time-synced; flag drift >60 seconds |
| Manual entry | Lowest | Require supervisor confirmation; flag for audit review |
Structured digital forms on rugged tablets reduced manual workload significantly in PTTEP’s deployment and enabled condition-based monitoring across multiple asset groups. The same principle applies here: standardized capture at the wellsite eliminates the transcription errors that make month-end reconciliation painful.
Retention policy matters. Immutable logs with a clear chain of custody are the difference between an audit that takes two hours and one that takes two weeks.
How do you turn downtime events into per-well financial impact?
Three allocation methods cover most upstream scenarios:
- Direct charge: link the work order to a single well and post the cost to that well’s GL code at event capture.
- Time-based apportionment: for shared equipment (a compressor serving multiple wells), allocate cost by hours of service per well during the outage period.
- Production-based allocation: convert lost uptime to deferred barrels, then apply the realized commodity price to calculate lost revenue.
| Event parameter | Example value |
|---|---|
| Deferred production | 90 BOE |
Integrated digital platforms that consolidate production, workover, and maintenance data reduce manual reporting time substantially and enable real-time dashboards for faster intervention planning. The key is capturing GL mappings at event entry, not retroactively. Finance should be able to produce a lease operating statement directly from the downtime ledger without rebuilding the allocation logic from scratch.
Analytics outputs to build: per-well downtime trend by category, top causes ranked by lost revenue, MTTR/MTBF dashboards by sub-asset, and an AI-generated executive brief that surfaces the top three recovery opportunities for the week.
What integrations and compliance outputs do you need?
- SCADA/RTU: real-time telemetry feed; the primary detection input.
- CMMS: work order creation, parts consumption, and labor hours linked to each downtime event.
- ERP/GL: expense posting with well-level cost codes; the bridge between field events and financial statements.
- Vendor portals: ticket ingestion so third-party service events appear in the downtime ledger automatically.
- BI tools: executive dashboards and scheduled report exports for investor and regulator reporting.
The most common integration failure is mismatched asset IDs between SCADA and the CMMS. A canonical asset registry, maintained as the single source of truth, with a mapping service that translates IDs at the integration layer, prevents that problem. Time synchronization is the second pitfall: SCADA clocks, field devices, and ERP systems on different time references produce event sequences that do not reconcile.
Compliance outputs for upstream operations include per-well lease operating statements, production allocation notes, and timestamped audit trails that satisfy both internal controls and state regulatory reporting requirements. API guidance for upstream operations provides a useful reference framework for data retention and event classification standards.
What does a phased rollout look like?
Phase 1: Pilot (weeks 1–8, 10–30 wells)
- Conduct baseline well tests and document current telemetry coverage gaps.
- Build the sub-asset hierarchy for pilot wells in the CMMS.
- Configure detection rules and calibrate thresholds against 90 days of historical telemetry.
- Deploy field validation workflow; target >80% approve/reject completion rate within 30 days.
- Success metric: detection precision above 85%, zero unresolved open events older than 48 hours.
Phase 2: Scale (weeks 9–20, cluster by basin)
- Replicate the asset hierarchy and detection rules across the next cluster.
- Integrate CMMS work orders and ERP GL codes; validate month-end reconciliation accuracy.
- Train reliability engineers on MTTR/MTBF dashboards and root-cause workflows.
Phase 3: Enterprise rollout (weeks 21–36, all assets)
- Complete SCADA integration across all pads and fields.
- Activate per-well P&L reporting and lease operating statement exports.
- Enable AI executive brief generation for weekly ops and finance review.
- Establish a cross-functional steering team (ops, reliability, finance) to own KPI governance.
Primary cost drivers: instrumentation gaps at older wells, data clean-up for legacy asset IDs, integration development for CMMS/ERP, and change management training for field crews. Pilot deployments that combine telemetry baselines, rule calibration, and operator validation produce prioritized work lists and measurable production uplift, which is the evidence base you need to justify the enterprise budget.
How do you evaluate and choose the right solution?
Run every candidate through this checklist before committing to a pilot:
- Does it support rules-based detection and configurable thresholds? Can you add ML-based anomaly detection later?
- Does it integrate natively with your SCADA historian, CMMS, and ERP, or does it require custom middleware?
- Can it produce per-well P&L and lease operating statement exports that finance can use directly?
- Does it maintain immutable audit trails with approver IDs and timestamps?
- What is the realistic deployment timeline for a 30-well pilot?
- Can it scale to your full asset count without a re-architecture?
Red flags to watch for:
- No field validation workflow. If operators cannot approve or reject automated flags at the wellsite, data quality will degrade within months.
- Opaque allocation logic. If finance cannot trace a cost allocation back to the source event and the rule that generated it, the system will not survive an audit.
- No per-well P&L export. A system that stops at operational dashboards forces finance to rebuild the financial picture manually every month.
For procurement, run a short pilot with pre-agreed acceptance criteria: detection precision target, field adoption rate, and reconciliation accuracy at month-end. Evaluate ops and finance requirements together; latency tolerance for operations (near-real-time) and reconciliation accuracy for finance (exact GL match) are not in conflict if the system captures GL codes at event entry.
Wellsmanager gives you the full field-to-finance stack
Wellsmanager is built specifically for upstream operators who need more than a dashboard. The platform covers every item on the checklist above: configurable rule-based detection, SCADA/CMMS/ERP integrations, per-well P&L and lease operating statement exports, immutable audit trails with approver timestamps, and AI-generated executive briefs that surface your top recovery opportunities without requiring a data analyst to build the report.
The deployment model is cloud SaaS, which means a pilot on 10–30 wells can go live without infrastructure procurement. Core modules relevant to downtime tracking include the field jobcard system, asset registry with sub-asset hierarchy support, finance GL mappings, and compliance notification engine. Audit readiness is built in, not bolted on.
Request access to start a pilot or schedule a walkthrough of the per-well P&L and downtime analytics modules.
Key Takeaways
Automated detection paired with field validation and per-well cost allocation at event capture is the only approach that gives operations and finance a single trusted downtime ledger.
| Point | Details |
|---|---|
| Automate detection with validation | Deploy rule-based triggers cross-validated against multiple telemetry signals, with an operator approve/reject step at the wellsite. |
| Structure assets by failure mode | Build sub-asset hierarchies (ESP motor, pump stages, seals) so MTTR and MTBF calculations reflect actual failure patterns. |
| Capture GL codes at event entry | Assign cost codes when the event is logged so finance can produce lease operating statements without retroactive rework. |
| Run a time-boxed pilot first | Start with 10–30 wells, target >80% field adoption and 85% detection precision before scaling. |
| Wellsmanager as your platform | Wellsmanager delivers per-well P&L, immutable audit trails, and AI executive briefs in a single upstream SaaS subscription. |
The part most operators underestimate
The technology is the easier half. The harder half is getting field crews to trust automated flags enough to engage with the approve/reject workflow consistently, and getting finance to accept operational event data as the authoritative source for expense allocation.
Both problems have the same root cause: no one owns the data across the boundary. Operations owns the telemetry. Finance owns the GL. Reliability owns the CMMS. When those three groups run separate systems with separate hierarchies, every downtime event gets reconciled three times, and the number is different each time.
The fix is a cross-functional steering team with a shared KPI set, not a technology mandate. Ops, reliability, and finance need to agree on the asset hierarchy, the allocation rules, and the acceptance criteria for automated flags before the first detection rule goes live. That conversation is uncomfortable because it forces trade-offs. But it is the only way the data stays trusted when the numbers matter most, which is at month-end close and during a regulatory review.
Field trust follows from transparency. When a crew member rejects an automated flag and sees that rejection reflected in the final record, they learn the system respects their judgment. When rejections disappear into a black box and the original flag shows up in the finance report anyway, they stop engaging. The approve/reject workflow is not just a data quality mechanism. It is a trust mechanism, and it is worth protecting.
Useful sources
- Downtime Detector: New Tool Tackles Production Downtime (JPT / SPE): covers ExxonMobil’s DTAS deployment, cross-validation logic, and the approve/reject workflow; essential reading for detection method design.
- Production Optimization through Operate by Priority: DTAS Deployment to Permian Wells (SPE 221082): documents pilot methodology, prioritized work list outputs, and production uplift evidence; use for pilot acceptance criteria.
- Unlocking Operational Excellence: Digital Jobcard Data for Predictive Maintenance (SPE 232399): PTTEP’s structured field capture program; supports the case for ruggedized digital forms and condition-based monitoring.
- A Unified Digital Platform for Well Restoration and Asset Management in Mature Fields (SPE 233189): integrated platform case study showing 60%+ reduction in manual reporting time; relevant for integration and analytics sections.
- A reliability-centred framework for sub-asset management in CMMS (Oilfield Technology): primary reference for failure-mode-based asset hierarchies, meter cascading, and serial continuity.
- Reliability Centered Maintenance for Oil & Gas: FMEA-Driven Strategy Selection (iFactory): practical RCM and FMEA guidance for shifting from time-based to condition-based maintenance in upstream operations.