Upstream Cost Allocation for Operators: A Practical Guide

Upstream cost allocation is the systematic assignment of field and corporate expenses to wells, leases, fields, and joint ventures so each working-interest partner pays its contractually agreed share. The single most important decision rule: the Joint Operating Agreement (JOA) and its COPAS exhibit govern what costs are recoverable and how the allocation math works. Get that document right before you touch a spreadsheet.
Typical upstream cost objects include:
- Wells (individual wellbore costs: workovers, artificial lift, chemicals)
- Leases or fields (lease operating expense, surface equipment maintenance)
- AFEs (Authorization for Expenditure: capital projects, major workovers)
- Joint ventures (shared infrastructure, pipeline tariffs, water disposal)
Quick examples of costs that flow through these objects: lease operating expense (LOE), capital expenditures (CAPEX) tied to drilling AFEs, fuel consumed at compression facilities, and flare volumes charged back to producing wells.
Pro Tip: Document your allocation methodology in the JOA or COPAS exhibit before month-end close. If the JOA and the COPAS exhibit conflict, the JOA governs. Any negotiated deviation from the standard COPAS overhead method needs a written amendment, or it will not survive an audit.
Recoverability rules matter as much as the math. Costs that are not explicitly permitted under the JOA cannot be billed to partners, regardless of how reasonable they seem internally. Build that list into your chart of accounts from day one.
Key Takeaways
Upstream cost allocation accuracy depends on three things working together: a well-documented JOA/COPAS exhibit, clean AFE-coded cost capture at the source, and a disciplined month-end cycle sequence.
| Point | Details |
|---|---|
| JOA/COPAS governs recoverability | Document the COPAS exhibit version and any negotiated deviations before running a single allocation cycle. |
| Driver choice determines fairness | Match each cost pool to a driver with a genuine cause-and-effect link; run ±15% sensitivity tests before locking in new drivers. |
| SAP sequencing prevents orphaned costs | Execute JVA recovery cycles before corporate overhead cycles; validate sender cost center balances after each run. |
| Hydrocarbon quantity allocation needs all streams | Include sales, fuel, flare, and recycle in quantity allocation or partner receipts will not reconcile to custody transfer volumes. |
| Wellsmanager centralizes allocation controls | Per-well cost coding, AFE enforcement, and JIB generation in one platform reduce manual rework and support partner audit requests. |
Table of Contents
- Which allocation methods work best in upstream accounting?
- How JOA and COPAS rules govern what you can bill to partners
- Month-end closing: SAP allocation cycles and sequencing
- Hydrocarbon quantity allocation: metering, shrinkage, and field measurement issues
- How do you choose the right allocation bases and drivers?
- Controls, reconciliation steps, and how to prevent partner disputes
- Worked example: allocating LOE across three wells
- How Wellsmanager supports cost allocation and speeds month-end close
- Why allocation discipline is the real measure of operator credibility
- Wellsmanager gives upstream operators a faster, cleaner path to month-end close
- Sources
Which allocation methods work best in upstream accounting?
The Corporate Finance Institute’s cost allocation framework describes the canonical steps: identify cost objects, accumulate costs into pools, select allocation bases, compute rates, and apply them. In upstream oil and gas, the choice of method determines both accuracy and the operational overhead your team carries every month.
Direct allocation assigns shared service costs straight to producing cost objects with no intermediate step. Fast and simple, but it ignores services that support other service departments, which can distort field-level economics on large, multi-facility operations.
Step-down (sequential) allocation processes support departments one at a time in a defined sequence, allocating each department’s costs to the remaining departments and to final cost objects. It handles one layer of interdependency well. The catch: the sequence order affects results, so document and defend the sequence in your procedures.
Reciprocal allocation solves simultaneous interdependencies between support departments using linear algebra. More accurate than step-down, but rarely worth the complexity unless you have multiple large shared-service centers billing each other.
Activity-based costing (ABC) traces costs to activities first, then to cost objects based on actual consumption. For complex shared services like a central engineering group supporting dozens of wells, ABC produces the most defensible allocations. The data collection burden is real, though.
Single-rate and prorate methods are the workhorses of upstream field cost distribution. Prorate by throughput (production barrels or Mcf) is the most common driver for field-level LOE. Well-count prorate works well for costs that are roughly equal per wellbore regardless of production rate, such as routine inspections or chemical treatments.
Hydrocarbon quantity allocation is a distinct discipline covered in detail below. It allocates measured or estimated volumes to individual wells or owners at custody transfer points, and peer-reviewed research confirms it must explicitly include sales streams, fuel, flare, and recycle to produce accurate partner receipts.
| Method | Accuracy | Data needs | Common upstream use |
|---|---|---|---|
| Direct | Low–Medium | Minimal | Simple two-party JVs |
| Step-down | Medium | Department cost data | Centralized support functions |
| Reciprocal | High | Simultaneous equations | Large shared-service centers |
| ABC | High | Activity drivers | Engineering, HSE, shared services |
| Prorate (throughput) | Medium | Production volumes | Field LOE, compression costs |
| Prorate (well-count) | Low–Medium | Well roster | Inspection, chemical programs |
| Hydrocarbon quantity | High | Metered volumes | Production accounting, JV splits |
Pro Tip: For most independent operators with fewer than 50 active wells, prorate by throughput is thought to cover the majority of field cost allocations cleanly. Reserve ABC for the shared-service pools where the cost is large enough to justify the data collection.
How JOA and COPAS rules govern what you can bill to partners
The JOA defines the working-interest percentages and the scope of the joint account. COPAS procedures, typically incorporated as an exhibit, set the overhead calculation method (fixed-rate or percentage of direct costs) and govern equipment valuation, salvage credits, and audit rights. When the two documents conflict, the JOA controls.
Recoverable costs are those the JOA explicitly permits to be charged to the joint account. Common examples:
- Direct site expenditures: labor, materials, chemicals, water disposal
- LOE: pumping, gauging, routine maintenance
- Equipment moves and rig mobilization tied to an approved AFE
- Overhead at the COPAS-agreed rate or percentage
Non-recoverable costs are typically:
- Corporate-level G&A not covered by the COPAS overhead formula
- Penalties, fines, and litigation costs arising from operator negligence
- Costs incurred outside an approved AFE without partner consent
- Certain financing costs and internal management fees
Recovery indicators in your accounting system flag whether a cost object is billable to partners. Manipulation rules control how the system processes those indicators during assessment and distribution cycles, preventing costs from being double-billed or dropped. Joint interest billing mechanics depend on clean AFE-coded expense data flowing into the JIB statement; missing or miscoded costs are the most common source of partner disputes.
Steps to keep JOA alignment tight:
- Embed the COPAS exhibit version number and effective date in your cost allocation procedures document.
- Get written approval from all working-interest partners before changing the overhead method mid-year.
- Require AFE authorization before any capital expenditure posts to the joint account.
- Preserve the full audit trail: original invoice, cost posting, allocation cycle run, and JIB statement.
Pro Tip: When a partner audits your JIB, the first thing they check is whether costs billed to the joint account match the approved AFE scope. Keep AFE amendments documented with partner sign-off, not just internal approval.
Month-end closing: SAP allocation cycles and sequencing
Month-end allocation in upstream companies typically runs two cycle types: JVA allocations (recovering operations costs from partners) and corporate allocations (distributing shared overhead to business units). SAP controlling cycles are the standard execution vehicle for both.
SAP uses two cycle families. Assessment cycles post costs using a secondary cost element (the sender cost center retains the original cost element detail). Distribution cycles post using the original primary cost element, preserving full line-item transparency on the receiver. For JIB reporting, distribution is usually preferred because partners can see the underlying cost categories.
SAP transaction codes:
- KSU1 — Create assessment cycle
- KSU2 — Change assessment cycle
- KSU3 — Display assessment cycle
- KSU5 — Execute assessment cycle
- KSV1 — Create distribution cycle
- KSV2 — Change distribution cycle
- KSV3 — Display distribution cycle
- KSV5 — Execute distribution cycle
Sequencing matters. Run JVA cost-recovery cycles before corporate overhead allocations so that recovered partner costs do not get swept into the overhead pool and re-allocated. If you have tiered allocations (field → area → region → corporate), execute them in that order or you will create orphaned costs that require manual correction.
A critical operational note: SAP does not support prior-period reversals through the standard period-close reversal transaction for allocation cycles. Corrections require a corrective posting in the current period. Build a pre-close validation step into your calendar to catch errors before the period locks.
Pro Tip: Run a zero-balance check on all sender cost centers after executing cycles. Any non-zero balance means a cost was not picked up by the cycle definition, usually because a new cost center was added mid-month without updating the cycle sender group.
Month-end reconciliation should also validate external quantity data (production volumes, metered throughput) against the allocation base used in the cycle. A volume discrepancy of even a few percent compounds across a large JV and generates disputes that take weeks to resolve.
Hydrocarbon quantity allocation: metering, shrinkage, and field measurement issues
Hydrocarbon quantity allocation distributes measured or estimated production volumes to individual wells, leases, or owners at defined custody transfer or allocation points. It is distinct from cost allocation but directly influences the cost-per-unit calculations used in financial reporting and reserve valuations based on industry understanding.
A peer-reviewed review published in the Journal of Petroleum Science and Engineering identifies the main quantity allocation approaches used in upstream operations:
- Measured flow prorate: each well’s allocated volume equals its metered rate divided by total field metered rate, multiplied by the custody transfer volume. Most accurate when all wells have reliable meters.
- Pro-rata by sales: allocates sales volumes back to wells proportionally. Used when wellhead metering is incomplete.
- Net-back allocation: starts from the sales point and works backward through processing losses, shrinkage, and fuel consumption to arrive at wellhead equivalents.
- Pipeline segment or custody transfer point allocation: allocates volumes at defined handoff points between operators or facilities, common in gathering system JVs.
Measurement uncertainty is where allocations go wrong. Meter accuracy, calibration frequency, liquid carryover in gas meters, and flash losses at separators all introduce error. When volumes are small or metering is poor, that uncertainty can materially shift partner receipts. The peer-reviewed literature confirms this directly: measurement uncertainty materially changes partner receipts when volumes are small or metering is inadequate.
Common field issues to address in your allocation procedures:
- Missing metering: use a documented estimation method (offset well rates, decline curve) and flag estimated volumes separately in the JIB.
- Fuel and flare allocation: allocate fuel consumed at compression or processing facilities back to wells proportionally by throughput. Flare volumes must be tracked separately for both regulatory reporting and partner billing.
- Theft and unaccounted-for losses: establish a loss threshold (often 0.5% of throughput) above which a formal investigation is triggered. Document the threshold in the JOA.
- Shrinkage and flash losses: apply shrinkage factors from gas processing agreements and flash factors from separator test data; update them at least annually or after major facility changes.
How do you choose the right allocation bases and drivers?
Choosing the wrong driver is the most common cause of allocation disputes. The right driver reflects a genuine cause-and-effect relationship between the cost and the cost object. AccountingTools’ guidance on allocation methods frames the core tradeoff: accuracy versus the cost of capturing the data.
A practical decision checklist:
- Relevance: does the driver actually cause the cost to vary? Production barrels drive chemical costs. Well count drives inspection costs. Headcount drives safety training costs.
- Measurability: can you pull the driver data from a reliable system without manual intervention every month?
- Fairness: would a working-interest partner accept this driver as a reasonable proxy if they audited your JIB?
- Stability: does the driver change so frequently that small fluctuations create large allocation swings?
- Cost of capture: is the data collection effort proportional to the cost being allocated?
Common upstream drivers and their best-fit cost types:
| Driver | Best fit |
|---|---|
| Production barrels / Mcf | LOE, chemical injection, water disposal |
| Well count | Inspection, routine maintenance, chemical programs |
| Throughput (Bbl/d or Mcf/d) | Compression, gathering, processing |
| Time-writing (labor hours) | Engineering, well services, HSE |
| Headcount | HR, safety training, benefits |
| Square footage | Facility maintenance, utilities |
Simple allocation rate formula: Rate = Total cost pool ÷ Total driver units. Per-well allocation = Rate × Well’s driver units.
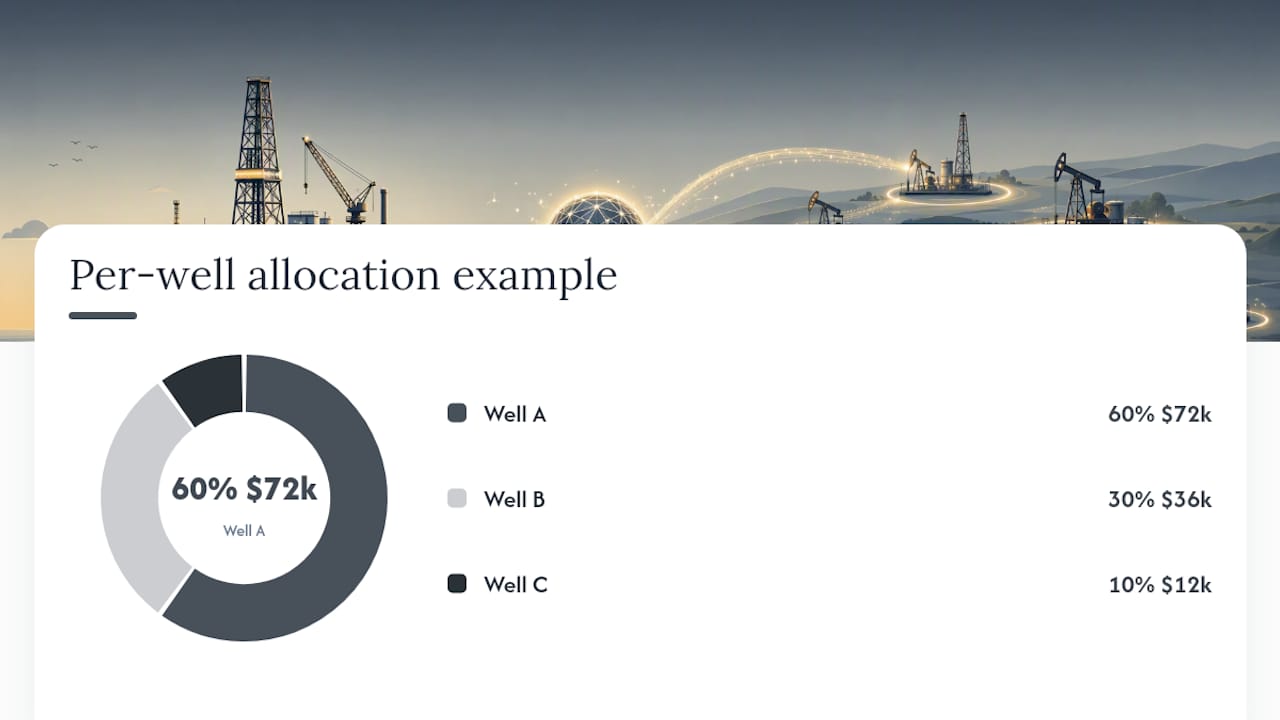
Example: $120,000 LOE pool, three wells with throughput of 600, 300, and 100 Bbl/month (1,000 total). Rate = $120 per Bbl. Well A: $72,000. Well B: $36,000. Well C: $12,000.
Pro Tip: Run a sensitivity test before locking in a new driver. Shift the driver values by ±15% and calculate the P&L impact per well. If a 15% volume swing moves one partner’s share by more than $50,000, document the sensitivity in the JOA exhibit so partners understand the exposure.
Tracking how field events affect your drivers is part of the discipline. Equipment downtime, for instance, can suppress a well’s throughput in a given month and shift its allocation share. A field-to-finance playbook that maps downtime events to cost objects keeps those distortions visible and defensible.

Controls, reconciliation steps, and how to prevent partner disputes
Clean allocations depend on clean inputs. AFE enforcement and per-job cost codes captured at the point of submission are the single most effective control. A cost that arrives at month-end without an AFE number or cost object requires manual recoding, which introduces error and delays the JIB.
Essential controls:
- AFE gate: no capital expenditure posts to the joint account without an approved AFE number.
- Mandatory cost object at submission: field staff cannot submit an expense without selecting a well, lease, or AFE from a validated list.
- Approver thresholds: tiered approval limits (field supervisor, operations manager, CFO) based on dollar amount.
- Automated validation: system rejects invoices that exceed AFE budget or reference a closed cost object.
- Allocation cycle lock: freeze cycle configurations at the start of month-end close to prevent mid-run changes.
Reconciliation workflow:
| Step | Action | Owner |
|---|---|---|
| 1 | Source invoice received and coded | AP / field staff |
| 2 | Cost posts to well/AFE cost object | Accounting |
| 3 | Allocation cycle executes | Finance / IT |
| 4 | JIB statement generated | Joint-interest accounting |
| 5 | Partner reconciliation and dispute window | All working-interest parties |
Dispute prevention starts with data completeness checks before the cycle runs, not after. Set a variance threshold (for example, ±2% between production accounting volumes and allocation base volumes) and require sign-off before executing the cycle. Document exception handling: when a threshold is breached, who approves the override and what evidence is retained?
For audit trail purposes, retain allocation cycle configuration snapshots, the driver data used in each run, and the approval evidence for any manual adjustments. Automated allocation tooling reduces manual reconciliation burden and provides auditable allocation histories that hold up under partner and regulatory review.
Worked example: allocating LOE across three wells
This example walks through a complete LOE allocation from cost capture to JIB posting.
Scenario: $90,000 in monthly LOE (chemicals, pumping, water disposal) shared across Wells A, B, and C on a single lease. A typical Joint Operating Agreement specifies a 70/30 throughput-to-well-count split for LOE.
-
Define the cost pool: $90,000 total LOE, confirmed against the general ledger and vendor invoices.
-
Split the pool by driver: 70% by throughput ($63,000) and 30% by well count ($27,000).
-
Gather driver data:
-
Compute per-well allocations:
-
Post the allocation: use a SAP distribution cycle (KSV1/KSV5) so the original cost elements (chemicals, pumping, disposal) remain visible on each well’s cost object. This preserves line-item detail for the JIB.
-
Generate the JIB: each working-interest partner receives a statement showing their ownership percentage applied to each well’s $40,— / $27,900 / $21,600 allocation. Net invoicing (one JIB per partner per period) is standard under COPAS.
-
Reconcile: confirm the sum of all partner JIB amounts equals $90,000. Any variance indicates a missing cost object or a cycle configuration error.
How Wellsmanager supports cost allocation and speeds month-end close
Wellsmanager is built around the operational reality that upstream allocation accuracy depends on data captured correctly in the field, not corrected at month-end. The platform’s per-well cost coding module requires field staff to assign a well, lease, or AFE at the point of expense submission, which eliminates the most common source of allocation rework.
Key capabilities that directly address the problems described in this guide:
- AFE enforcement: expenditures cannot post to the joint account without a valid AFE reference, enforcing the gate control that protects partner billing integrity.
- Per-well P&L tracking: costs and revenues are visible at the wellbore level in real time, so allocation anomalies surface before month-end close rather than during partner reconciliation.
- JIB statement generation: the platform produces partner-ready JIB statements from the posted allocation data, reducing manual assembly and the transcription errors that generate disputes.
- Configurable allocation cycles: operators can define throughput, well-count, or blended drivers within the platform and run allocation cycles without exporting data to a separate system.
- Audit trails: every cost posting, allocation run, and approval action is logged with a timestamp and user ID, meeting the documentation standard that COPAS audits require.
- AI-generated executive briefs: after allocation cycles close, Wellsmanager can generate a summary of per-well cost performance and variance explanations for operator leadership and investors.
Storing your COPAS exhibit language and allocation methodology documentation inside the platform means auditors and partners access the same version of the truth your accounting team used. That single-source approach is what a centralized upstream data model looks like in practice.
Pro Tip: Use Wellsmanager’s invoice approval workflow to enforce AFE and cost-object coding at the point of invoice submission. Costs that arrive pre-coded require no manual intervention at month-end, which is where most allocation errors originate.
Why allocation discipline is the real measure of operator credibility
Most allocation disputes are not about the math. They are about trust. A partner who receives a JIB statement they cannot trace back to source invoices and approved AFEs will question every line, regardless of whether the numbers are correct. The operators who avoid that friction are not necessarily running more sophisticated allocation models. They are the ones who documented their methodology before the first dollar was billed, enforced AFE coding at the field level, and ran their month-end cycles in the right sequence.
The peer-reviewed hydrocarbon allocation literature makes a similar point from the measurement side: when metering is poor and allocation procedures are undocumented, even a technically correct prorate calculation produces results that partners cannot verify. The answer is not a better formula. It is better data governance upstream of the formula.
Wellsmanager addresses this at the operational layer, where the data quality problem actually originates. Per-well cost coding enforced at submission, configurable allocation cycles, and automated JIB generation do not replace accounting judgment. They remove the manual steps where errors accumulate and audit trails go cold.
Wellsmanager gives upstream operators a faster, cleaner path to month-end close
Per-well P&L visibility, AFE-controlled cost capture, and partner-ready JIB statements in a single platform: that is what Wellsmanager delivers to upstream operators who are done rebuilding allocation schedules in spreadsheets every month-end.
The allocation problems this guide describes, from miscoded field expenses to disputed JIB statements to SAP cycle sequencing errors, share a common root: data that was not captured correctly at the source. Wellsmanager enforces cost-object coding at invoice submission, runs configurable allocation cycles against that clean data, and generates auditable JIB statements your partners can trace to source documents. The audit trail is automatic, not assembled after the fact.
Teams that move allocation execution into Wellsmanager typically see fewer manual corrections at month-end close and faster partner reconciliation cycles, because the disputes that used to consume the first two weeks of the following month simply do not arise.
Request access to see how Wellsmanager fits your operation, or explore the full platform at Wellsmanager.
Sources
The sources below support the governance, technical, and system guidance in this guide.
- Joint interest billing and how it relates to oil and gas accounting — COPAS
- DOI:10.1016/j.petrol.2019.106590 (hydrocarbon allocation review)
- A review of hydrocarbon allocation methods in the upstream oil and gas industry — ScienceDirect
- Month End Closing Allocations for Upstream Companies — SAP Community
- Cost Allocation - Definition, Types, Steps, Benefits — Corporate Finance Institute
- Joint Interest Billing: How JIB Works in Oil and Gas — LegalClarity
- Cost allocation methods — AccountingTools
- Cost allocation overview and tooling benefits — HighRadius
This article is general informational guidance, not legal, tax, or accounting advice. Confirm current JOA terms, COPAS exhibit provisions, and applicable regulations with a qualified professional before implementing allocation changes.