Vendor Spend Analysis: A Practical Playbook for Procurement Teams

Vendor spend analysis is the process of collecting, cleaning, classifying, and acting on all spending data tied to your suppliers so you can find savings, reduce risk, and negotiate from a position of strength. The canonical four-step lifecycle runs: data aggregation, data cleansing and normalization, classification, and analysis with prioritized action. If you have never run one before, start with a single high-spend category or your top 20 vendors by dollar volume. That scoped pilot will surface enough issues to justify a full program and give you a concrete win within 30 days.
Table of Contents
- What does vendor spend analysis actually cover?
- The four-step lifecycle, broken down
- Why vendor spend analysis delivers real financial impact
- Common pitfalls that derail vendor spend analysis
- How to run a vendor spend analysis: a step-by-step playbook
- Sourcing waves, governance, and getting stakeholders aligned
- What features should a spend analytics tool actually have?
- How upstream oil and gas operators apply vendor spend analysis
- Key Takeaways
- The part most teams get wrong
- Wellsmanager gives upstream operators a faster path to spend visibility
- Useful sources and further reading
What does vendor spend analysis actually cover?
Vendor spend analysis sits one level below enterprise-wide spend analysis. Enterprise spend analysis looks at all organizational spending across every category, cost center, and geography. Category spend analysis zooms into a single commodity or service family. Vendor spend analysis focuses specifically on the supplier relationship: who you are paying, how much, under what terms, and whether those terms are being honored.
The distinction matters when you are planning scope. A category analysis tells you that you spend $4.2M on industrial chemicals. A vendor analysis tells you that $2.8M of that goes to three suppliers, one of whom has no active contract and another who is billing 12% above the agreed rate.
Typical data sources to pull:
- Purchase orders from your ERP or procurement system
- Invoices from accounts payable
- Contracts and amendments from your contract repository
- General ledger transactions (GL) for any spend that bypasses PO
- Purchasing card (P-card) and travel and expense (T&E) records
- Procurement system records including catalog orders and spot buys
When to run vendor-level vs. category-level analysis:
- Run vendor-level when you are preparing for a contract renewal, consolidating suppliers, or investigating compliance issues with a specific supplier
- Run category-level when you are launching a sourcing event, benchmarking market pricing, or building a commodity strategy
- Run both when you are standing up a new spend analytics program or responding to a cost-reduction mandate
The four-step lifecycle, broken down
Step 1: Data aggregation
Pull data from every system that records a payment or commitment to a supplier. That means your ERP (SAP, Oracle, Microsoft Dynamics), your AP system, your PO module, your contract repository, and any e-procurement platform like Coupa or Jaggaer. For upstream oil and gas operators, add field ticket systems and work order management tools, since a significant share of vendor spend originates in the field before it ever reaches AP.
The goal at this stage is completeness, not cleanliness. Extract everything, including P-card transactions and T&E reimbursements that often hide unmanaged vendor spend.
Step 2: Data cleansing and normalization
Raw procurement data is almost always messy. The same supplier appears as “Acme Corp,” “ACME Corporation,” and “Acme Corp.” with a trailing period. Three different vendor IDs point to the same legal entity. Invoices are dated in different fiscal periods than the POs they reference.
Common cleansing rules to automate first:
- Deduplicate vendor names using fuzzy matching on legal name, tax ID (EIN/TIN), and address
- Standardize currency to a single reporting currency with a consistent exchange rate source
- Align invoice dates to the PO or goods receipt date for period-accurate reporting
- Flag invoices with no corresponding PO or contract reference
- Merge vendor master records where the same supplier holds multiple IDs
Step 3: Classification
Assign every spend line to a taxonomy. Most organizations use a modified version of the UNSPSC (United Nations Standard Products and Services Code) or build a custom hierarchy that maps to their business units and cost centers. The choice of taxonomy matters less than consistency: pick one and apply it everywhere.
Rule-based classification works well for high-volume, predictable spend categories. Machine-learning-assisted classification handles the long tail of ambiguous line items faster and more accurately at scale. Either way, run a reconciliation sample of 200–300 records manually to validate accuracy before you trust the output.
Step 4: Analysis and action
This is where the sourcing wave plan lives. Typical analyses include spend concentration by vendor (what percentage of total spend goes to your top 10 suppliers), contract compliance rates (what share of spend is covered by an active contract), and maverick spend identification (purchases made outside approved channels or contracts). Each finding should map to a specific action: consolidate vendors in a category, renegotiate a contract, launch a competitive RFQ, or enforce a preferred-supplier policy.
Why vendor spend analysis delivers real financial impact
The business case is straightforward. You cannot negotiate what you cannot see, and most organizations are paying more than they should because their spend data is fragmented across systems, business units, and geographies.
According to a Protiviti source-to-pay assessment of an upstream offshore drilling firm, the engagement identified approximately $20M in potential savings and surfaced visibility into roughly $3B in total spend, along with numerous process pain points that had been invisible before the analysis. That is not an outlier result. It reflects what happens when an organization with complex field operations finally connects its procurement data end to end.
Core benefits procurement and finance leaders can expect:
- Cost savings through supplier consolidation and volume leverage
- Stronger negotiation positions backed by actual spend data rather than estimates
- Reduced maverick spend as preferred suppliers become visible and enforced
- Improved contract compliance when spend is linked to active agreements
- Earlier supplier risk signals when concentration or dependency becomes visible
The savings levers are specific. Consolidating five vendors in a category to two typically unlocks volume discounts. Running a should-cost analysis that decomposes a supplier’s quote into raw materials, labor, overhead, logistics, and margin gives you a defensible negotiation floor. Enforcing contract pricing on invoices that are billing above agreed rates recovers money that is already owed to you.
Stat to know: The Protiviti offshore drilling engagement identified significant potential savings once spend visibility and category management were applied to a large spend base.
Common pitfalls that derail vendor spend analysis
The analysis itself is rarely the hard part. The hard part is getting clean, complete data and keeping it that way.
Data silos are the most common obstacle. AP owns invoice data, operations owns field tickets, and finance owns the GL. None of these teams has an incentive to share data proactively, and no single system holds the full picture. The mitigation is a formal data-sharing agreement and a centralized data extract process with named owners in each function.
Duplicate vendors inflate your supplier count and fragment your spend picture. A vendor that appears under three different names looks like three small suppliers instead of one significant one, which means you never negotiate the volume discount you deserve. Automated deduplication using tax ID matching is the fastest fix.
Poor contract linkage means you cannot calculate compliance rates. If invoices are not tagged to a contract number, you have no way to know whether the price on the invoice matches the agreed rate. Tagging invoices to contracts at the point of AP entry is the governance fix; retroactive tagging for historical data is a one-time project worth doing before your first analysis.
Tail and maverick spend hides in P-cards, T&E, and one-off purchase orders. It is often 20–30% of total spend by transaction count but a smaller share by dollar value, which is why it gets ignored. The problem is that it represents unmanaged risk and missed consolidation opportunity.
Pro Tip: Before you run your first analysis, do a vendor master sweep. Pull every vendor record, run fuzzy matching on name and tax ID, and build a merge plan. A clean vendor master is the single highest-leverage data quality fix you can make, and it takes one to two weeks with the right tooling.
How to run a vendor spend analysis: a step-by-step playbook
Step 0: Define objectives and KPIs
Decide what success looks like before you touch the data. Are you trying to reduce total vendor count? Improve contract compliance from 60% to 85%? Identify $500K in savings to fund a sourcing initiative? The objective shapes every downstream decision about scope, classification, and prioritization.
Step 1: Scope and pilot selection
Pick a category or vendor cohort with high spend, low data complexity, and a near-term contract event. Facilities management, logistics, or MRO (maintenance, repair, and operations) are common starting points. For oil and gas operators, oilfield services spend is the obvious pilot: high dollar value, many vendors, and significant invoice variance.
Step 2: Data aggregation and canonical extract
Pull a standard extract with these fields for every transaction in scope:
| Field | Description |
|---|---|
| Vendor ID | System-assigned unique identifier |
| Vendor name (all variants) | All name strings associated with the vendor ID |
| PO number | Purchase order reference |
| Invoice number | AP invoice reference |
| Invoice date | Date of invoice receipt |
| GL account | General ledger account code |
| Category / commodity code | Spend category or UNSPSC code |
| Contract reference | Linked contract ID or number |
| Unit cost | Price per unit on the invoice |
| Quantity | Units invoiced |
| Currency | Transaction currency |
| GRN / receiving reference | Goods receipt or field ticket number |
Step 3: Cleansing checklist
Run these rules in order before any analysis:
- Deduplicate vendor records by EIN/TIN and fuzzy name match
- Normalize all amounts to USD using a consistent exchange rate (monthly average from the Federal Reserve or your treasury policy)
- Link invoices to POs and flag unmatched invoices
- Link invoices to contracts and flag spend with no contract reference
- Align transaction dates to the correct fiscal period
- Remove intercompany transactions and employee expense reimbursements from vendor spend totals
Step 4: Classification and taxonomy mapping
Map every spend line to your taxonomy. Validate a random sample of at least 200 records before accepting the full classification output. Where a line item does not fit an existing category, create a catch-all “unclassified” bucket rather than forcing a wrong assignment. Unclassified spend is a signal, not a failure.
Step 5: Analysis techniques
Spend concentration: Calculate the percentage of total spend going to your top 10 vendors. If that number exceeds 70%, you have both leverage and dependency risk.
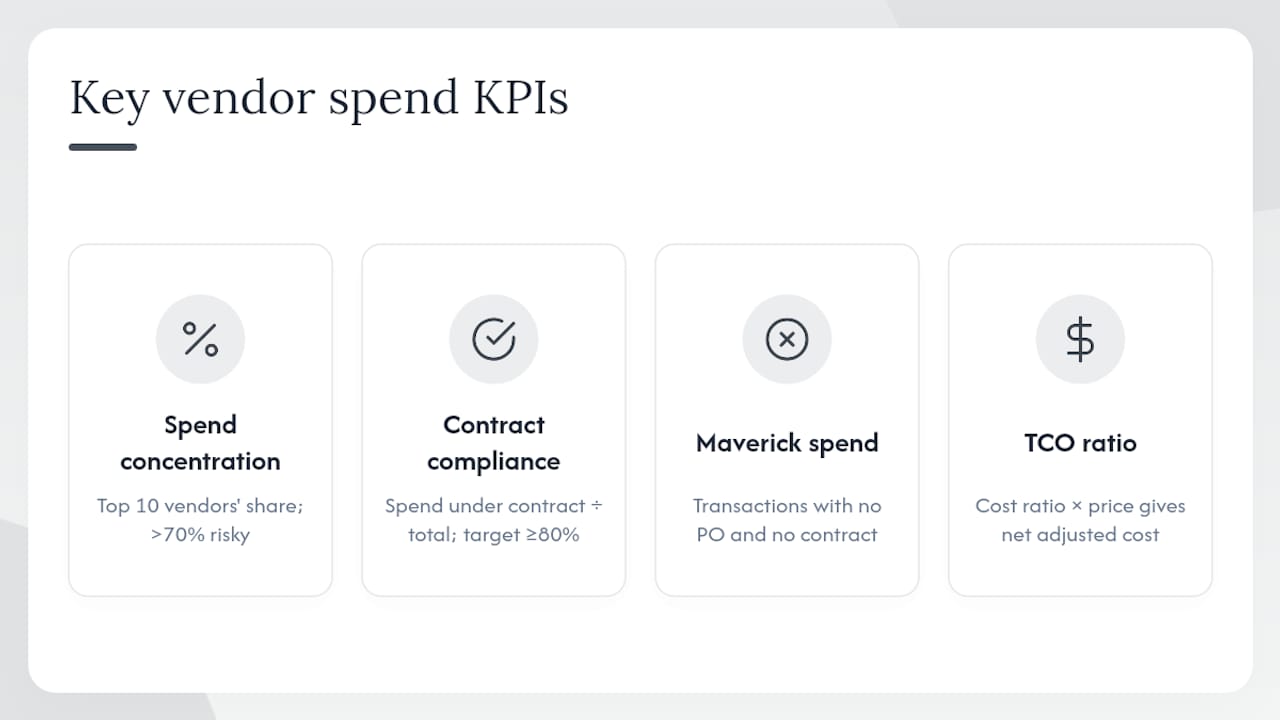
Contract compliance rate: Divide spend under active contracts by total spend. Anything below 80% is a governance problem worth addressing before the next sourcing cycle.
Maverick spend: Identify transactions with no PO and no contract reference. Segment by business unit to find where the compliance gaps are worst.
Net Adjusted Unit Price (TCO comparison): The Vendor Rating Cost Ratio method converts quality failures, late deliveries, and other internal costs into a cost ratio, then multiplies it by the quoted unit price to produce a true cost comparison. If Vendor A quotes $100/unit but generates $8 in internal processing costs per unit (cost ratio = 1.08), the net adjusted price is $108. Vendor B at $104/unit with no quality issues has a net adjusted price of $104 and is the better buy.
Step 6: Prioritization scoring for sourcing waves
Score each vendor or category on four dimensions, then rank by total score:
| Dimension | Weight | Score (1–5) | Weighted Score |
|---|---|---|---|
| Financial impact | — | 4 | — |
| Ease of capture | — | 3 | — |
| Risk reduction | — | 5 | — |
| Strategic importance | — | 2 | — |
Categories scoring above 3.5 go into Wave 1. Wave 2 covers scores from 2.5 to 3.5. Everything below 2.5 is deferred or handled through policy rather than a sourcing event.
Step 7: Timeline and cadence
| Phase | Timeline | Output |
|---|---|---|
| Pilot (scoped category) | Days 1–30 | Clean data extract, vendor master merge plan, initial spend map |
| First analysis and action plan | Days 31 to 60 | Sourcing wave prioritization, quick-win list, KPI baseline |
| First sourcing wave execution | Days 61 to 90 | RFQ or negotiation for Wave 1 categories |
| Quarterly review cadence | Ongoing | Updated spend dashboard, compliance tracking, wave progress |
Realistic time-to-impact for the first measurable savings: 60–90 days for quick wins like contract enforcement and duplicate vendor consolidation. Larger sourcing events typically close in 90–180 days.
Sourcing waves, governance, and getting stakeholders aligned
Analysis without governance is just a report. The organizations that capture sustained savings treat vendor spend analysis as a continuous program, not a one-time project.
Sourcing wave planning checklist:
- Rank categories by the prioritization score from Step 6 above
- Confirm internal resource availability (category manager, legal, finance) before committing to a wave
- Set a savings target and a timeline for each wave before launch
- Assign a single accountable owner per wave, not a committee
- Review wave progress monthly and adjust sequencing if market conditions change
Governance requires clear ownership. Assign vendor master management to a named individual in procurement operations. Contract repository standards should be set by legal and enforced by procurement. Reporting cadence should be monthly for active sourcing waves and quarterly for the full spend dashboard.
The cross-functional RACI looks like this in practice: procurement owns the analysis, sourcing strategy, and vendor negotiations; finance owns GL mapping, budget alignment, and savings validation; operations or field management owns the service-level inputs and field ticket approvals; compliance owns contract terms and regulatory requirements.
Tie every vendor scorecard to the contract renewal calendar. A supplier whose on-time delivery rate dropped from 94% to 81% over the past two quarters should face that data at the renewal table, not after the contract is signed.
What features should a spend analytics tool actually have?
The tool is not the strategy, but the wrong tool will slow you down. When evaluating spend analytics platforms or modules within your existing ERP, check for these capabilities:
Data and integration checklist:
- Native connectors to your ERP (SAP, Oracle, Microsoft Dynamics) and AP system
- P-card and T&E data ingestion
- Contract repository linkage with active/expired status flags
- Field data feeds for operators with field ticket or work order systems
- API access for custom integrations
Analytics and reporting checklist:
- Vendor master management with duplicate detection
- Automated cleansing rules (configurable, not hard-coded)
- Taxonomy management with UNSPSC or custom hierarchy support
- Dashboards with drillback tables and cost-variance visuals so analysts can trace a summary number back to individual transactions
- Alerting for spend threshold breaches, contract expirations, and compliance anomalies
Governance and security checklist:
- Role-based access control (procurement, finance, operations each see what they need)
- Audit trails for every data change and approval
- Data lineage so you can trace a KPI back to its source transaction
On vendor selection: prioritize implementation speed and total cost of ownership over feature count. A platform that takes 18 months to implement and requires a dedicated data team will not deliver ROI faster than a well-configured module in your existing ERP. For upstream operators specifically, the ability to ingest field ticket data and link it to AP invoices is a non-negotiable capability that most generic spend analytics tools do not handle natively.
How upstream oil and gas operators apply vendor spend analysis
Upstream oil and gas is one of the most data-intensive and vendor-heavy operating environments in any industry. A single well completion can involve dozens of service vendors, from drilling contractors and wireline companies to chemical suppliers and rental equipment providers. The billing complexity is significant: field tickets, day-rate invoices, AFE (Authorization for Expenditure) charges, and lump-sum contracts often coexist for the same well.

The Protiviti offshore drilling case illustrates the scale of the opportunity. Before the source-to-pay assessment, the operator had limited visibility into its $3B spend base. The engagement identified $20M in potential savings and surfaced a long list of process pain points, including manual approval workflows, inconsistent field ticket capture, and poor contract linkage across service categories.
Per-well KPIs that matter for vendor analysis in upstream operations:
- Vendor spend per well (total invoiced spend per well per period)
- Cost per service event (e.g., cost per wireline run, cost per workover day)
- Invoice rework rate (% of invoices requiring correction before approval)
- Vendor on-time delivery % (field tickets matched to scheduled service dates)
- Field ticket-to-invoice variance ($ difference between field ticket and final invoice)
The category-specific challenges in upstream are real. Service billing is complex: a single day-rate invoice may cover multiple cost codes, multiple wells, and multiple AFEs. High-volume small invoices from chemical and consumable suppliers create noise that obscures the larger service spend. Field ticket variance, where the invoice does not match the approved field ticket, is endemic and expensive to resolve manually.
Automation reduces that noise significantly. When field tickets are captured digitally and matched to invoices automatically, the reconciliation that used to take a week takes hours. That match rate becomes a KPI in itself.
Pro Tip: Link every field ticket to its corresponding invoice before you run your spend analysis. The field ticket is your ground truth for what was actually delivered. Without that link, your TCO calculations for oilfield service vendors are based on what was billed, not what was received, and those two numbers are often not the same.
Wellsmanager is built specifically for this environment. The platform centralizes field maintenance logs, vendor records, and invoice data in one place, with per-well P&L tracking that connects field-level costs directly to financial outcomes. For operators running spend analytics in an oilfield context, that field-to-finance linkage is what makes vendor analysis reliable rather than approximate.
Key Takeaways
Vendor spend analysis works when clean data, a structured lifecycle, and a prioritized sourcing wave plan operate together, not in isolation.
| Point | Details |
|---|---|
| Start with a scoped pilot | Pick your top 20 vendors or one high-spend category to surface quick wins within 30 days. |
| Fix vendor master first | Deduplicating vendor records before analysis is the single highest-leverage data quality step. |
| Track six core KPIs | Spend concentration, contract compliance rate, maverick spend %, Net Adjusted Unit Price, invoice cycle time, and total spend by vendor. |
| Sequence savings in waves | Score categories by financial impact, ease of capture, risk reduction, and strategic importance, then execute in prioritized waves. |
| Wellsmanager for upstream operators | Wellsmanager connects field tickets, vendor records, and per-well P&L in one platform, making oilfield vendor spend analysis reliable and auditable. |
The part most teams get wrong
The technical steps in vendor spend analysis are well documented. The part that actually determines whether a program succeeds is change management, and almost nobody talks about it plainly.
Procurement teams that run a clean analysis and produce a sharp sourcing wave plan still fail to capture savings when operations refuses to switch vendors, when finance will not validate the savings methodology, or when leadership treats the whole exercise as a procurement project rather than a business priority. The data is not the obstacle. The organizational dynamics are.
The fastest path to a sustained program is an early win that finance can validate and operations can live with. That usually means starting with a category where the incumbent vendor relationship is not politically sensitive, the contract is expiring soon, and the spend is large enough to produce a savings number that gets executive attention. One successful wave funds the next one and builds the credibility to tackle harder categories.
Resistance to centralized procurement controls is almost always rooted in a fear of losing operational flexibility. The answer is not to argue about control. Show operations that better vendor data means fewer invoice disputes, faster approvals, and more reliable service delivery. That framing converts skeptics faster than any governance mandate.
For upstream operators specifically, the field-to-finance gap is where the most value is hiding. If your field supervisors are approving tickets manually and your AP team is reconciling them weeks later, you are not running vendor spend analysis. You are running vendor spend archaeology. Closing that gap with the right platform changes the economics of the whole program.
Wellsmanager gives upstream operators a faster path to spend visibility
Most spend analytics programs stall because the data infrastructure is not there yet. For upstream oil and gas operators, that problem is acute: field tickets, service invoices, AFE charges, and equipment costs live in different systems, and reconciling them manually is a full-time job that still produces incomplete results.
Wellsmanager is built to close that gap. The platform connects field maintenance logs, vendor records, invoice data, and per-well P&L in a single operating system designed for upstream operators. Contract tagging, audit trails, and role-based access mean your spend data is not just visible but defensible. The BI tools and AI-generated executive briefs give finance and procurement the reporting they need without custom development. Operators get faster invoice reconciliation, less rework, and clearer per-well cost visibility from day one.
If you are ready to move from spreadsheets to a real spend analytics foundation, request access to Wellsmanager or visit wellsmanager.com to see how the platform maps to the playbook in this guide.
Useful sources and further reading
-
Vendor spend analysis: Key components and steps — GEP: — The clearest published walkthrough of the four-step lifecycle and common KPIs. Start here if you are building a methodology from scratch.
-
Cut costs, not corners: Smarter vendor spend analysis strategies — Amazon Business: — Practical guidance on uncovering maverick spend, consolidating suppliers, and structuring sourcing waves. Useful for teams moving from analysis to action.
-
Offshore Drilling Firm Finds Major Savings Through Source-To-Pay Assessment — Protiviti: — The upstream oil and gas case study referenced throughout this guide. Read it for the process pain point inventory and the savings identification methodology.
-
Vendor Rating Cost Ratio Calculator — ERP-Information: — The reference for the Net Adjusted Unit Price calculation. Use the calculator to run your own TCO comparisons before a sourcing event.
-
Supplier cost breakdown analysis: A complete guide for US businesses — Wise: — The should-cost methodology explained clearly, with the five cost categories (materials, labor, overhead, logistics, margin) and how to use them in negotiations.
-
Vendor spend analysis: Key benefits, steps & best practices — Ramp: — A concise best-practices summary covering automation, consistent categorization, and vendor scorecards. Good for sharing with stakeholders who need a quick orientation to the topic.
-
Wellsmanager blog: Sector-specific articles on upstream operations, field-to-finance reconciliation, and vendor management for oil and gas operators.