Oil and Gas Dashboards: A Practical Guide for US Operators
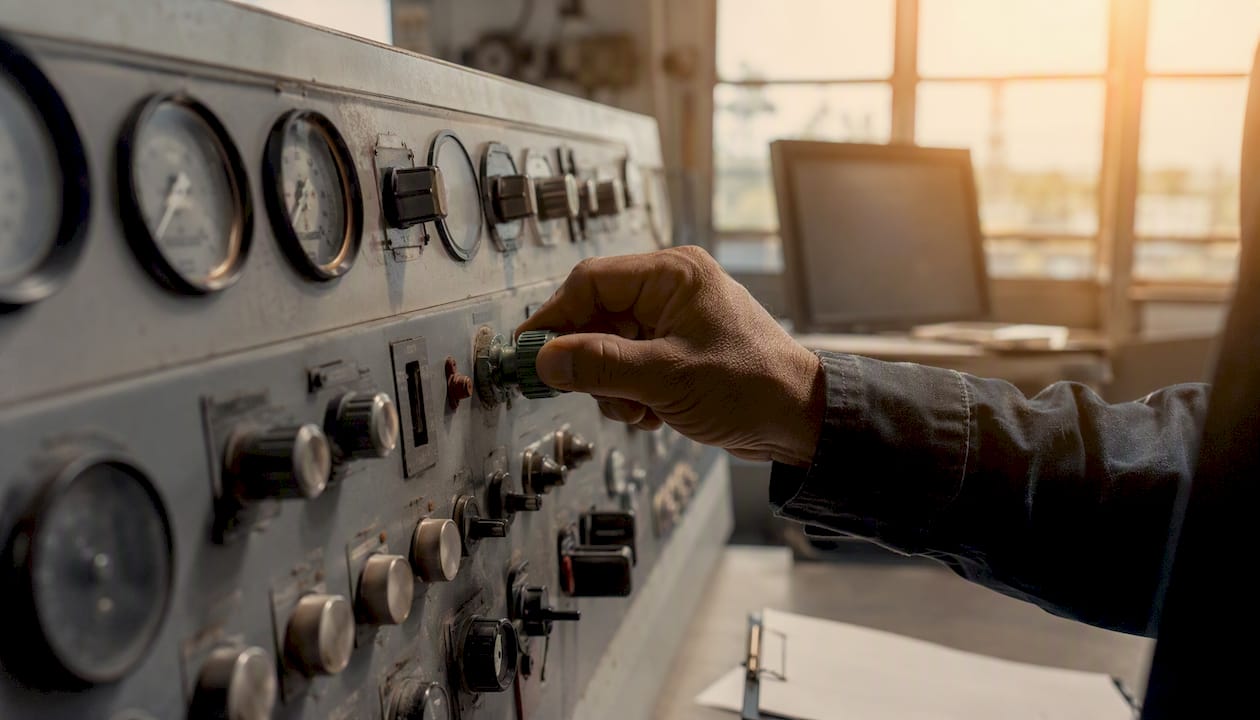
Oil and gas dashboards are operator-facing, role-based interfaces that consolidate real-time SCADA/historian, meter, finance, and regulatory feeds into glanceable views for production, maintenance, compliance, and per-well P&L. Every upstream team needs six core dashboard types: production monitoring, well performance, maintenance/HSE, compliance and emissions (EPA GHGRP/Subpart W), finance and per-well P&L, and executive portfolio summary. For teams that want field-to-finance continuity without stitching together five separate tools, a single integrated platform like Wellsmanager built around ISA-101 display principles and EPA GHGRP reporting is the most direct path to consistent, trusted numbers across every role.
Must-have dashboard types for US upstream operators:
- Production monitoring — real-time output, GOR, water cut, and downtime by well or pad
- Well performance — decline curves, test data, and deviation from type curve
- Maintenance and reliability — work orders, uptime, MTTR, and MTBF by asset
- HSE and alarm board — active alarms, incident log, and permit status
- Compliance and emissions — Subpart W/GHGRP reported volumes, exceedance alerts
- Finance and per-well P&L — netback, realized price, lease operating expenses, and investor distributions
- Executive summary — portfolio-level production, revenue, and compliance status
Key Takeaways
Operator-first oil and gas dashboards require locked KPI definitions, clean source-system integration, and role-based views matched to each team’s decision clock before any screen goes live.
| Point | Details |
|---|---|
| Start with six dashboard types | Production, well performance, maintenance, HSE, compliance/emissions, and finance/per-well P&L cover every upstream role. |
| Lock KPI definitions first | Gross vs. net conventions and time-window rules must be agreed before any dashboard is built to prevent costly rework. |
| Match refresh rate to decision clock | Finance P&L cards update on daily close cycles; production alarms update in minutes — mismatching these destroys user trust. |
| Use EPA GHGRP as your compliance reference | Reconcile internal emissions dashboards against the EPA GHGRP Subpart W public dashboard before any regulatory submission. |
| Wellsmanager closes the field-to-finance loop | Field downtime events, per-well P&L, live pricing, and compliance alerts live in one platform, eliminating end-of-month reconciliation. |
Table of Contents
- What do oil and gas dashboards actually show?
- Which KPIs belong on each dashboard type?
- Where does dashboard data come from?
- What visualization patterns work best for operational dashboards?
- How long does a dashboard implementation actually take?
- Where can you find dashboard templates and live examples?
- How Wellsmanager closes the field-to-finance loop
- Why operator-first design is the only design that matters
- Wellsmanager: per-well P&L and field ops in one platform
- Sources
What do oil and gas dashboards actually show?
Each dashboard type serves a different clock and a different decision. Knowing which one to build first saves months of scope creep.
Production monitoring runs on a minutes-to-hours clock. Field operators and pumpers watch live output from SCADA or historian feeds, catching rate drops before they compound into lost revenue. A typical use case: a sudden GOR spike on a single well triggers an investigation before the separator is overwhelmed.
Well performance dashboards operate on a daily-to-weekly cadence. Engineers compare actual production against type curves and decline models, flagging candidates for workover or artificial lift optimization. The decision it enables is straightforward: which wells need intervention this month?
Maintenance and reliability views are built for reliability engineers and field supervisors. They track open work orders, equipment uptime, and failure history. When a pump’s MTBF drops below its historical baseline, the dashboard surfaces it before an unplanned failure takes the well offline.
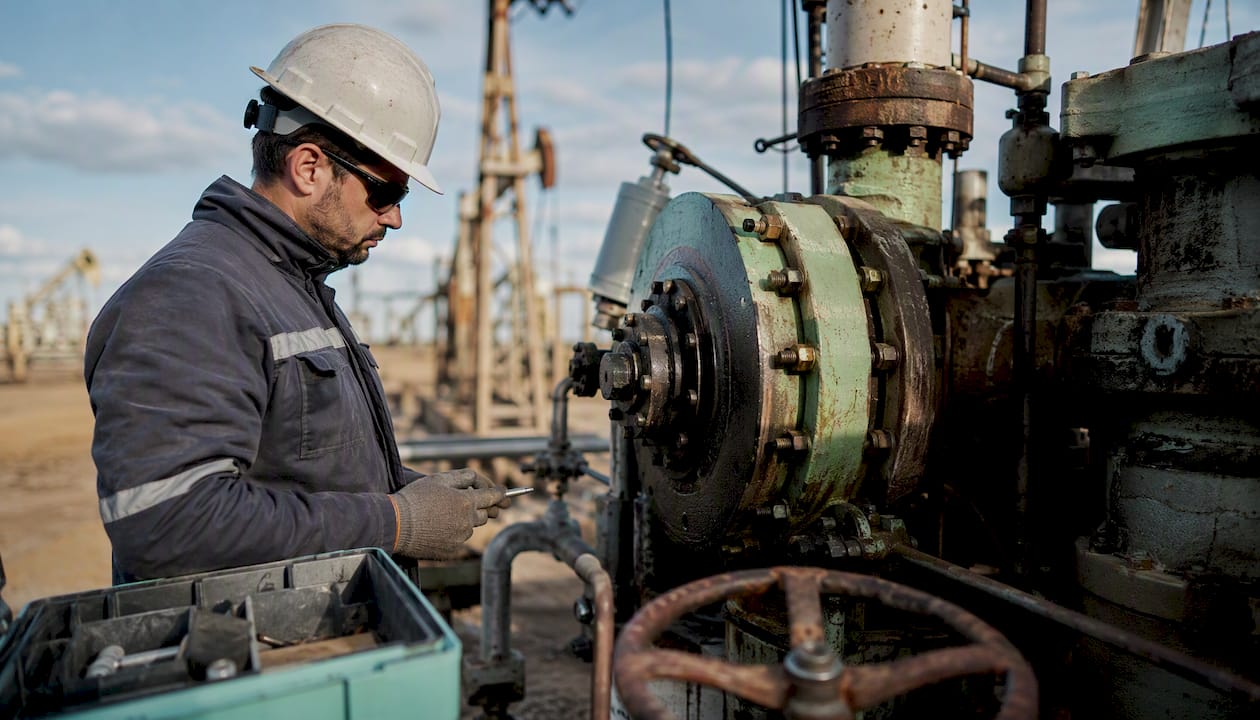
HSE and alarm boards give safety teams a live picture of active alarms, permit-to-work status, and incident counts. The ISA-18.2 alarm management standard directly shapes how these boards should be structured — priority tiers, suppression rules, and shift-handoff summaries all belong here.
Compliance and emissions dashboards are non-negotiable for US operators subject to EPA Subpart W reporting. The EPA GHGRP Oil and Gas Dashboard is the authoritative public reference for facility-level Subpart W emissions, and operators should reconcile their internal numbers against it regularly.
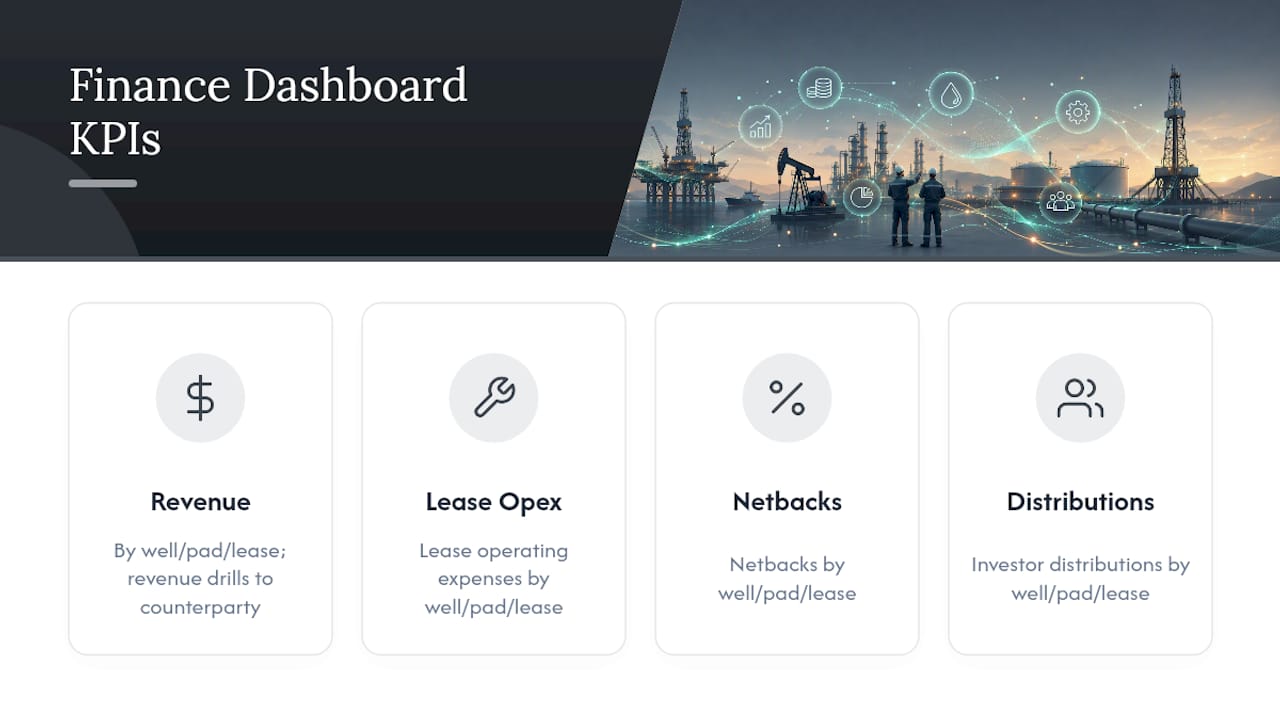
Finance and per-well P&L views are where comptrollers and CFOs live. They consolidate revenue, lease operating expenses, netbacks, and investor distributions by well, pad, or lease. Revenue-focused dashboards that drill down by counterparty, contract, and meter are the standard pattern here.
Executive summary dashboards compress everything above into a single-screen portfolio view. Production volumes, revenue trends, compliance status, and key variance flags — all visible in under 30 seconds.
Which KPIs belong on each dashboard type?
Consistent KPI definitions prevent the most common dashboard failure: two teams looking at the same metric and getting different numbers.
Production and well performance KPIs
- Daily output (BOE/d): gross wellhead volume converted to barrels of oil equivalent; source is SCADA or fiscal meter
- GOR (gas-oil ratio): produced gas (MCF/d) ÷ produced oil (bbl/d); watch for seasonal separator temperature effects that inflate apparent GOR
- Water cut (%): produced water (bbl/d) ÷ total liquid (bbl/d) × 100; a rising water cut is the earliest signal of reservoir depletion or casing integrity issues
- Decline rate: month-over-month production change expressed as a percentage; always specify gross vs. net working interest before publishing to avoid definition conflicts
Reliability KPIs
- Uptime (%): hours producing ÷ total calendar hours × 100
- MTTR (mean time to repair): total downtime hours ÷ number of failure events
- MTBF (mean time between failures): total uptime hours ÷ number of failure events
Finance KPIs
- Netback ($/BOE): realized price minus royalties, transportation, and LOE; the single most useful per-well profitability signal
- Per-well P&L: gross revenue minus all well-level costs including allocated overhead; requires clean cost allocation rules from your ERP
- Realized price ($/bbl or $/MCF): actual sale price after differentials and deductions, sourced from your revenue accounting system
Pro Tip: Lock your gross vs. net definitions and your time-window conventions (calendar month vs. producing day) before a single dashboard goes live. Changing them after deployment means recalculating every historical trend line.
The EPA GHG Data Portal publishes facility-level emissions datasets that operators can use to cross-check internal emissions KPIs against public disclosures, which is especially useful ahead of regulatory audits.
Where does dashboard data come from?
The data architecture question is where most dashboard projects stall. Getting the source mapping right early prevents the most expensive rework.
Primary source systems for US upstream:
- SCADA/PI historians — real-time sensor data (pressures, temperatures, flow rates) at second-to-minute granularity; the backbone of production and reliability dashboards
- Fiscal meters and allocation systems — custody-transfer volumes that feed revenue accounting; never substitute SCADA estimates for fiscal meter data in a P&L dashboard
- ERP and accounting systems — LOE, AFE costs, vendor invoices, and revenue settlements; the source of truth for per-well P&L
- CMMS (computerized maintenance management) — work orders, failure codes, and parts history for reliability dashboards
- Well test data — periodic multi-rate tests that calibrate SCADA allocation models
- Market pricing feeds — live WTI, Henry Hub, and basis differentials for realized-price calculations
- EPA GHGRP registry — Subpart W reported emissions for compliance reconciliation
Integration patterns worth knowing:
- Real-time feeds via MQTT or OPC-UA for SCADA data into a time-series database or PI historian
- Batch ETL from historians to a data lake or warehouse for trend analysis and finance joins
- API pulls from ERP on a daily or hourly schedule for cost and revenue data
- Canonical data model that standardizes well IDs, unit conversions (bbls vs. MCF), and timestamp alignment across all sources before any dashboard query touches the data
Open-source petro-dashboard projects demonstrate that modern stacks using React, Python, and D3.js can handle 100k+ records at second-level sensor granularity — useful benchmarks when scoping your own architecture.
Data quality validation steps before go-live:
- Map every KPI to its source field and confirm unit conventions (gross vs. net, MCF vs. MMBTU)
- Align timestamps across systems — SCADA UTC vs. ERP local time is a common mismatch
- Flag missing-data gaps with explicit null markers rather than zero-filling
- Validate allocation totals against fiscal meter closes for the prior three months
- Confirm role-based access controls and audit trail logging are active before any live data flows
Security and governance are not optional. Role-based access — field operators see their wells, engineers see their area, finance sees costs, executives see the portfolio — prevents both data leaks and the confusion that comes from showing a pumper a netback chart they cannot act on.
What visualization patterns work best for operational dashboards?
The right widget for the wrong context is just noise. These patterns match the operational reality of upstream teams.
High-value widget types:
- Glance cards — one number, one trend arrow, one threshold color; the first thing an operator sees at shift start
- Small-multiple time series — the same metric (daily output, GOR) plotted for 10–20 wells in a grid; engineers spot outliers in seconds
- Geospatial well maps — production or status overlaid on a field map; Data can supply base map layers and regulatory reference overlays
- Waterfall/netback charts — price minus each deduction category, ending at realized netback; the clearest way to show finance teams where margin goes
- Uptime heatmaps — wells on one axis, days on the other, color-coded by uptime percentage; a month of reliability history in one glance
- Alarm strip/Andon board — active alarms ranked by priority tier, with suppression status and time-in-alarm; structured per ISA-18.2 to prevent alarm fatigue
Industrial HMI and dashboard guidance under ISA-101 prescribes a four-level display hierarchy: Level 1 for plant-wide overview, Level 2 for area/unit, Level 3 for equipment detail, and Level 4 for diagnostic data. That hierarchy maps cleanly onto executive summary → field area → well → sensor for upstream operations.
Pro Tip: Set refresh rates by decision clock, not by what the data feed can technically deliver. A per-well P&L card refreshing every 30 seconds creates distrust — finance numbers move on a daily close cycle. Match the widget’s refresh rate to the action it supports.
How long does a dashboard implementation actually take?
Realistic timelines prevent the most common project failure: a six-month scope that produces nothing usable in month one.
Implementation checklist and phase estimates:
- Discovery and KPI governance (2–3 weeks): define KPIs, lock gross/net conventions, identify source systems, and assign data owners; skip this and every downstream phase costs double
- Source mapping and data ingestion (3–6 weeks): connect SCADA/historian, ERP, and meter feeds; build the canonical data model; validate allocation totals
- Prototype screens (1–2 weeks): wireframe the MVP dashboard with real data; get sign-off from the field crew and finance lead before building anything polished
- Pilot with one operator crew (2–4 weeks): deploy the MVP to a single pad or area; measure adoption and surface data-quality issues before scaling
- Iterate and harden (2–3 weeks): fix data gaps, refine thresholds, add role-based views based on pilot feedback
- Full rollout (4–8 weeks): scale to remaining wells, areas, and user roles; train field staff; activate compliance and finance modules
A typical production-grade deployment usually takes several months, depending on integration complexity.
Cost drivers to scope early:
- Number of distinct source systems requiring connectors (each historian or ERP integration adds weeks)
- Required refresh rates — sub-minute real-time feeds cost more than daily batch
- Whether geospatial or digital twin mapping is needed
- Role-based UI design complexity across field, engineering, finance, and executive views
Start with a finance or production MVP. Locking KPI definitions in week one and using a canonical data model from the start are the two moves that most reliably prevent mid-project restarts.
Where can you find dashboard templates and live examples?
Starting from a blank screen wastes time. These resources give you a working reference point.
- EPA GHGRP Oil and Gas Dashboard — the live public reference for Subpart W emissions; inspect its filtering and trend patterns as a compliance dashboard template
- Open-source petro-dashboard repo — React/Python/D3.js implementation with production KPIs, GOR, water cut, and compliance alert patterns; useful for engineering teams building custom views
- Revenue dashboard example — shows per-well P&L, netback, and counterparty drill-down layout; a direct reference for finance dashboard design
- Value-chain geospatial dashboards (such as the Energy Path product from East Daley) show how commodity flows from wellhead to demand can be mapped spatially — useful for portfolio-level executive views
One-screen operator view: well status (producing/shut-in/down), current rate vs. target, active alarms, and last 24-hour trend. Nothing else.
Engineer drill-down: decline curve vs. actual, GOR and water cut trends, last three well tests, and open work orders. Linked from the operator view.
Executive summary page: total portfolio BOE/d, revenue vs. budget, compliance status (green/yellow/red), and top five variance wells. Designed for a 60-second read.
When adapting any template for scale, agree on KPI definitions first, build widgets as modular components that can be reused across well views, and design for mobile from the start — field supervisors check dashboards on phones, not desktop monitors.
How Wellsmanager closes the field-to-finance loop
Wellsmanager is built specifically for US upstream operators who need production, maintenance, compliance, and finance data in one place rather than reconciled across separate systems.
Features that map directly to the requirements above:
- Per-well P&L and lease operating statements — every well’s revenue, LOE, and netback calculated automatically from field logs and revenue settlements
- Field maintenance logging — downtime events recorded in the field flow directly into reliability KPIs and impact per-well P&L in real time, closing the loop that most operators currently close with a spreadsheet
- Live commodity pricing — WTI and Henry Hub feeds integrated into realized-price calculations without manual updates
- Compliance notifications — Subpart W and other regulatory deadlines surfaced as alerts before they become violations
- Audit trails — every data change logged with user, timestamp, and prior value; critical for investor reporting and regulatory review
- AI-generated executive briefs — portfolio summaries generated from live data, reducing the time finance teams spend building weekly reports
A practical example of the field-to-finance loop: a pumper logs a compressor failure in the field. Wellsmanager records the downtime event, calculates the lost production volume, and adjusts that well’s P&L for the period automatically. The CFO sees the impact on the executive dashboard the same day, not at month-end close.
Questions to ask any dashboard vendor during evaluation:
- Which SCADA historians and ERP systems do you connect to natively, and what is the integration timeline?
- What is the minimum refresh rate for production KPIs, and how is it priced?
- How are per-well cost allocations handled when a well is on multiple leases?
- What role-based access controls exist, and is there a full audit trail?
- How are Subpart W compliance notifications triggered and delivered?
Wellsmanager’s single source of truth approach addresses the data-silo problem that makes most multi-tool dashboard stacks unreliable. Request access to see the platform with your own well data.
Why operator-first design is the only design that matters
Most dashboard projects fail not because of bad technology but because they were designed for the wrong person. A CFO-first dashboard that shows portfolio netbacks is useless to a pumper deciding whether to call out a well at 6 AM. An engineer-first decline curve view tells a comptroller nothing about whether this month’s LOE is on budget.
The operator-first principle means every view is designed around a specific decision, made by a specific role, on a specific time horizon. The executive summary exists to answer “are we on track this month?” in 60 seconds. The alarm board exists to answer “what needs my attention right now?” in under 10 seconds. When those questions drive the design, adoption follows naturally because the dashboard earns its place in the daily workflow.
The second thing most teams underestimate is the cost of bad KPI governance. Agreeing on gross vs. net, on calendar days vs. producing days, and on which meter is the fiscal source of truth — before any screen is built — is the single highest-leverage investment in a dashboard program. Every hour spent on that governance in week one saves a week of rework in month four.
Wellsmanager’s per-well P&L and field maintenance logging modules are built around this principle: the field event and the financial impact live in the same system, so the definition conflict never arises.
Wellsmanager: per-well P&L and field ops in one platform
Independent operators running on spreadsheets and disconnected point tools spend more time reconciling numbers than acting on them. Wellsmanager replaces that reconciliation cycle with a single platform where field maintenance logs, well expenses, revenue settlements, and compliance alerts all feed the same per-well P&L.
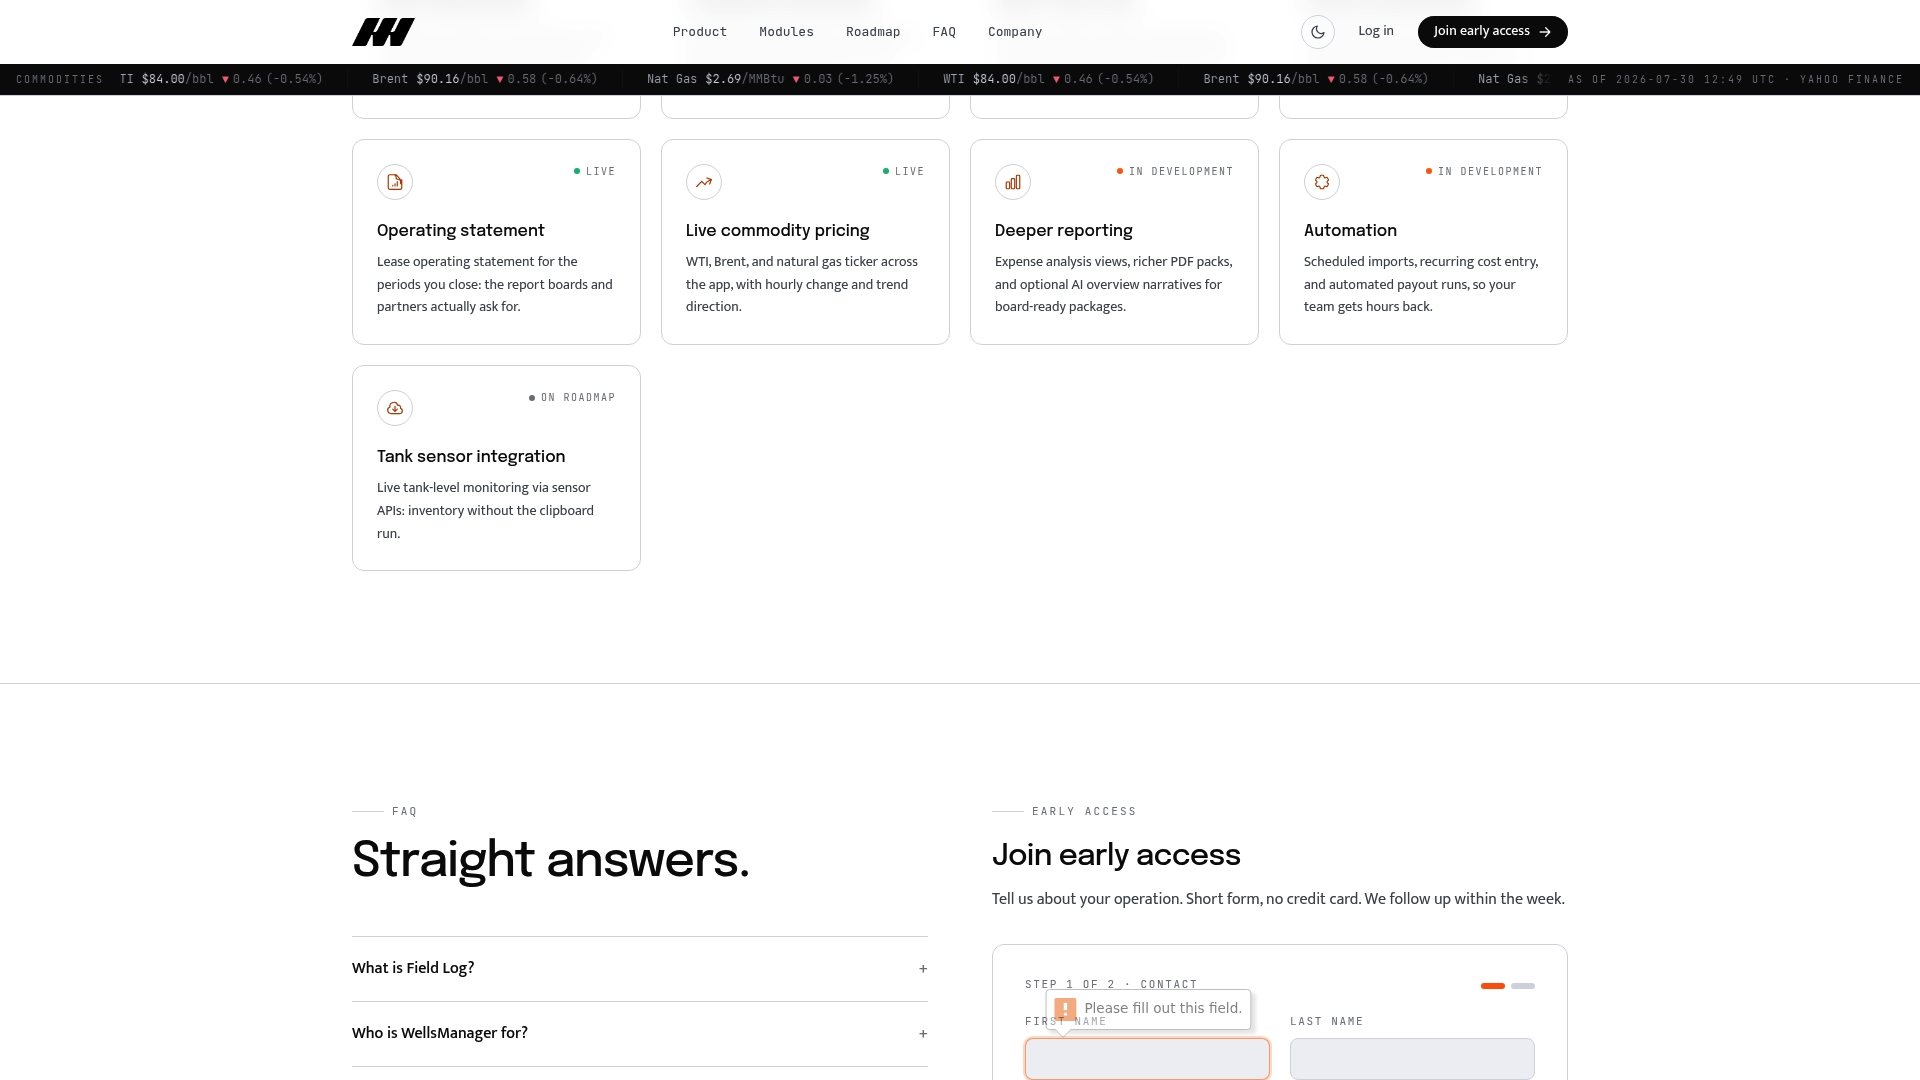
The concrete difference: when a field event happens, its financial impact shows up in the same system the same day, not at month-end when the damage is already done. Live commodity pricing, automated investor distributions, and AI-generated executive briefs are included in the subscription, not sold as add-ons. For US upstream operators who want production, finance, and compliance visibility without a six-month integration project, Wellsmanager is built for exactly that scope. Request access and see it running on your well data.
Sources
Use EPA sources for regulatory compliance validation; use ISA-101 and open-source repos for production design guidance.
- xwl0722/petro-dashboard
- Oil and Gas Revenue Dashboard
- GHGRP Oil and Gas Dashboard: Subpart W Summary
- EPA GHG Data Portal