Natural Language Reporting: A Practical Guide for Analysts

Natural language reporting converts a plain-English question into a structured, reproducible data report, complete with the query, the chart, and a written summary of what changed. The immediate action for any team considering it is not picking a tool. It’s mapping your metric definitions and exposing a semantic layer or clean schema first, because that groundwork determines whether the answers are trustworthy or just plausible-sounding.
Before you flip the switch on any natural language analytics layer, get these in order:
- Write down canonical definitions for every metric you’ll query (what counts as “production,” “downtime,” “net revenue interest”).
- Expose a semantic layer or well-documented schema so the query engine (typically SQL under the hood) knows what your tables mean.
- Decide whether you need an LLM at all, or whether a narrower text-to-SQL translator solves the problem with less risk.
- Check governance requirements relevant to your industry, since frameworks like the EU AI Act are pushing more scrutiny onto automated decision systems, even in analytics contexts.
Platforms like Wellsmanager build this groundwork into the product rather than leaving operators to assemble it themselves.
Key Takeaways
Natural language reporting only works reliably when clean metric definitions and a documented semantic layer exist before the language model ever sees a question.
| Point | Details |
|---|---|
| Definition first | Natural language reporting turns a plain-English question into a structured, reproducible report with query, chart, and narrative. |
| Semantic layer is the foundation | Map metric definitions and expose a schema or semantic layer before enabling any NL reporting tool. |
| Provenance builds trust | Store the SQL, model version, and result snapshot behind every report so it can be replayed and verified. |
| Errors trace to metadata, not hallucination | Most inaccuracies come from ambiguous definitions and stale metadata rather than the model inventing answers. |
| Keep humans in high-stakes loops | Require review gates for investor and regulatory reports even after automating routine queries. |
| Wellsmanager applies this to upstream operations | Its AI connector queries per-well production, expense, and distribution data using the same canonical definitions across the platform. |
Table of Contents
- What Natural Language Reporting Actually Is
- How Natural Language Reporting Works Under the Hood
- Who Benefits and How They Use It
- What You Need Before You Turn It On
- Where Natural Language Reporting Breaks Down
- Choosing How to Implement It
- Natural Language Reporting in Upstream Operations
- Training Your NLP Models to Actually Understand Reporting
- Getting Your Team to Actually Use It
- How This Compares to Traditional Reporting
- What Actually Matters Once the Demo Ends
- See How Wellsmanager Handles This for Oil and Gas Operators
- Sources
- FAQ
What Natural Language Reporting Actually Is
Natural language reporting is broader than a natural language query (NLQ) box that returns a single number. It’s the full pipeline: question in, formatted report out, with charts, filtered tables, and often a short narrative explaining the “so what.” A basic NLQ tool answers “What was March oil production?” with a number. Natural language reporting answers “How did March oil production compare to February, and what drove the change?” with a trend chart, a filtered table by well, and two sentences of context.
Typical outputs include:
- A single KPI card, like current month lease operating expense per barrel.
- A trend line across a chosen date range with automatic annotations for anomalies.
- A filtered table, for instance downtime hours by well for the last quarter.
- An executive narrative summary written in plain sentences, not just numbers.
- A downloadable PDF or CSV version of the same report for board packets or investor updates.
Analysts tend to use this for ad hoc digging, managers for status checks, and field or operations leads for quick answers without opening a dashboard.
How Natural Language Reporting Works Under the Hood
The mechanics run through five stages, and understanding them matters because each one is a place where accuracy can break down.
- Ingestion and warehousing. Raw data from field logs, accounting systems, and sensors lands in a data warehouse or operational database.
- Semantic layer and metadata. A layer sits on top of the raw tables, translating “downtime” or “net revenue” into consistent, documented definitions the system can reference.
- Intent parsing. The natural language engine reads the question and identifies what’s being asked (a comparison, a trend, a single value) and which entities are involved (which well, which date range).
- Query translation. The parsed intent becomes a query, usually SQL, sometimes an API call to a BI platform’s own query layer. This is the step where feeding the model explicit table schemas, column descriptions, and join relationships dramatically improves accuracy and cuts down on invalid joins that quietly corrupt results.
- Execution and rendering. The query runs against the warehouse, and the results get formatted into a chart, table, or narrative.
Provenance is what separates a trustworthy system from a black box. Every claim in a generated narrative should trace back to one specific query. A reproducible reporting agent stores the SQL, the model version, the prompt template, and a snapshot of the result set so anyone can replay the report later and get the same numbers. That same source found most analytics errors trace back to ambiguous metric definitions and stale metadata, not to the language model hallucinating. That’s a meaningful distinction for anyone deciding where to invest cleanup effort first.
Who Benefits and How They Use It
The core benefit is speed. A question that used to mean filing a ticket with the BI team now gets answered in seconds, and that shift extends self-service reporting to people who never learned SQL. Reports also get more consistent, since the same question asked twice returns the same structure instead of whatever format the analyst felt like building that day.
Different roles lean on it differently:
- Data analysts ask exploratory questions like “Show me wells with declining production and rising expenses over the last six months,” then dig deeper from there.
- Business users and managers ask status questions: “What’s our current cash position across all leases?”
- IT and operations leads ask operational questions: “Which wells had unplanned downtime this week, and what caused it?”
A concrete scenario: a production manager asks, “How did Well 14’s output change after the workover in September?” The system pulls pre and post intervention production data, generates a trend chart, and writes two sentences noting the percentage change and whether it matches the expected uplift from the intervention.
Pro Tip: Start with the three questions your team asks most often every week. Build and validate those first instead of trying to support unlimited open-ended queries on day one.
What You Need Before You Turn It On
A natural language reporting layer is only as reliable as what sits underneath it. Before rollout, work through this checklist:
- Clean data pipelines. Garbage in still means garbage out, no matter how good the language model is.
- Canonical metric definitions. Every term the system might encounter, “net production,” “workover cost,” “royalty interest,” needs one agreed-upon definition, not three competing versions across departments.
- A semantic layer. This maps business terms to the actual tables and columns, and it’s what makes synonym handling and visualization mapping work reliably instead of guessing.
- Access controls. Not every user should be able to query investor distribution data or well-level financials.
- Sample prompts and templates. Give users a starting library of questions that work, rather than a blank box and hope.
On governance, log every query and its output for audit purposes, version your models so you know which version generated which report, and keep records long enough to satisfy any regulatory retention requirement your business faces.
Operationally, precompute expensive aggregates rather than running heavy joins live on every question. Limit resource-intensive queries during business hours. And require human sign-off before any AI-generated report goes to investors or regulators.
Pro Tip: Treat your metric glossary as a living document. Review it quarterly, because a definition that was accurate last year quietly becomes wrong when your chart of accounts changes.
Where Natural Language Reporting Breaks Down
No system handles every question perfectly, and pretending otherwise sets teams up for a bad first impression. The common failure points:
- Ambiguous terms. “Revenue” might mean gross, net, or net-of-royalty depending on who’s asking.
- Hallucinated interpretations. A language model layered on top of the query engine can occasionally invent a plausible-sounding but wrong explanation for a trend.
- Query cost and performance. Open-ended questions can trigger expensive full-table scans if nothing bounds them.
- Stale metric definitions. A semantic layer that isn’t maintained will confidently return the wrong number using last year’s definition.
Mitigate this by forcing SQL generation through a validated template rather than free-form text, attaching a citation (the exact query and row count) to every narrative claim, and setting result bounds so a vague question can’t accidentally trigger a warehouse-wide scan.
Pro Tip: Run a weekly replay check on a sample of generated reports, rerunning the stored query and comparing the output to what was originally shown. Drift here is your earliest warning sign of a metadata problem.
Choosing How to Implement It
Three broad patterns dominate the market, and each comes with real trade-offs.
- BI-native Q&A. Built into platforms like Power BI, this approach lets users type plain-English questions directly into an existing BI tool and get a chart back. It’s fast to deploy since it’s already inside tools teams use, but it’s constrained to whatever data model that BI tool already has connected, and vendors do sometimes deprecate or reshape these features, so check the product roadmap before betting heavily on it.
- Text-to-SQL with a model plus schema. A language model translates the question into SQL against your own documented schema. This is more flexible and works across whatever warehouse you use, but it takes real engineering investment to build the schema descriptions and validation layer properly.
- LLM narrative layer over precomputed data. The model doesn’t touch raw data at all. It only writes narrative text describing numbers that were already calculated elsewhere. This is the safest pattern against hallucination since the arithmetic happens in the data layer, not in the language model.
- Hybrid approaches combine guided question builders, which help non-technical users construct better queries through suggestions rather than blank free-text boxes, with a text-to-SQL backend.
Weigh accuracy against speed, development cost against configurability, and plan for cost controls like query estimation and rate limiting before heavy usage hits your warehouse bill.
Natural Language Reporting in Upstream Operations
Picture a field operations manager asking, “Why did Well 22’s expenses spike in October, and how does downtime compare to the rest of the pad?” A canonical per-well profit and loss layer turns that into a real answer instead of a guess, pulling downtime hours, maintenance costs, and production variance into one filtered report.
That reliability depends entirely on having consistent well-level definitions across accounting and field data, something most operators cobble together manually across spreadsheets. Wellsmanager’s AI connector is built specifically to query per-well operational and financial data this way, so the same question returns the same trustworthy numbers regardless of who asks it.
Training Your NLP Models to Actually Understand Reporting
Generic language models weren’t trained on your chart of accounts or your field terminology, and that gap is where most early natural language reporting deployments stumble. Fine-tuning or prompt-engineering for reporting specifically means feeding the system your actual schema, your synonym list, and examples of good question-to-query pairs, not relying on the model’s general knowledge of “revenue” or “production.”
Start by cataloging the terms your users actually type, not the terms in your data dictionary. Field staff say “downtime,” accounting says “non-productive time,” and a well-tuned system needs to know those are the same thing. Build a synonym map and feed it into whatever semantic layer sits between the question and the query.
Test with real historical questions your team has actually asked, not synthetic examples. Run each one through the system, check the generated SQL by hand, and correct the ones that go wrong before they reach end users. This iterative correction loop matters more than any one-time training pass, because reporting language evolves as your business does. Version everything, including prompt templates, so when accuracy shifts you can trace it to a specific change rather than guessing.
Keep humans in the loop for edge cases. A model that returns “I’m not confident in this answer” for an ambiguous query is more useful than one that confidently guesses wrong. Build that uncertainty threshold into the tuning process rather than treating every question as answerable.
Getting Your Team to Actually Use It
The biggest rollout failure isn’t technical. It’s a natural language reporting tool that launches to enthusiasm and then gets abandoned within a month because the first few answers were wrong or confusing. Trust, once broken, is hard to rebuild with a user base.
Start small and start visible. Pick one team, one set of questions, and get those working reliably before expanding scope. A finance team that gets accurate distribution reports on the first try will champion the tool internally far more effectively than any training deck.
Provide a starter library of sample questions that are known to work well. Blank-box free text intimidates business users who don’t know what phrasing the system expects. Guided suggestions and step-by-step question building measurably improve relevance for non-technical users compared to pure free-text entry.
Common challenges during rollout include users assuming the system understands context it doesn’t (asking follow-up questions without restating the well or date range), users testing edge cases immediately and judging the whole tool on those failures, and IT underestimating how much metadata cleanup the project actually requires before launch.
Address these directly. Set expectations in training that follow-up questions need explicit context. Frame early limitations honestly rather than overselling. And budget real time for metadata work up front, because that’s the part every rollout timeline underestimates.
How This Compares to Traditional Reporting
Traditional reporting means someone builds a dashboard or a scheduled report, and every new question outside that scope means a request to the BI team, a wait, and a new report. That model scales poorly. Dashboards proliferate, most go stale, and the people who need answers fastest, field managers, investors, executives, wait longest for custom pulls.
Natural language reporting flips that. Instead of pre-building every possible view, you build the semantic layer once and let the question define the report. The trade-off is real, though: a dashboard someone spent hours perfecting is often more polished and predictable than an AI-generated one, and for recurring, high-stakes reports (investor distribution statements, regulatory filings), a fixed, human-reviewed template still beats a dynamically generated answer.
The practical answer for most teams is both, not either. Keep your critical, repeating reports as vetted templates, and use natural language reporting for exploratory questions and one-off digging where a traditional report would be overkill. Well-structured AI reporting pipelines can significantly reduce report production time by eliminating many manual steps when the underlying data is clean and review gates are in place, but that gain shows up in speed to a first answer, not necessarily in replacing every polished executive dashboard you already trust.
What Actually Matters Once the Demo Ends
Everyone gets excited about the natural language interface. The teams that succeed long term are the ones obsessed with what’s underneath it: reproducibility, tight metric definitions, and a human checking anything that leaves the building. Start there, not with the chatbot.

See How Wellsmanager Handles This for Oil and Gas Operators
Most natural language reporting tools are built for generic business data, not for the specific mess of per-well production, lease operating statements, and investor distributions that independent operators actually deal with. Wellsmanager’s AI connector was built directly on top of that operational reality, so a question about a specific well’s expenses or downtime pulls from the same canonical data used for compliance and investor reporting, not a separate approximation. That means less time reconciling numbers between your field team’s spreadsheet and your accountant’s ledger, and more time acting on what the numbers actually say. If you’re managing wells and tired of waiting on manual reports, request access to Wellsmanager and see what an AI-powered executive brief looks like when it’s built for your data from the ground up.
Sources
- Building AI Report Generation for SaaS: Natural Language to Analytics | CallSphere Blog
- AI-Generated Analytics Reports: Building Workflows That Write Themselves
- Automate Reporting with AI: From Data to Insights
FAQ
Is ChatGPT an NLP tool?
ChatGPT is built on natural language processing techniques, but it’s a general-purpose language model, not a reporting-specific NLP system. Natural language reporting tools typically combine an NLP layer (sometimes an LLM like the ones behind ChatGPT) with a separate query engine and semantic layer to ensure answers trace back to real data.
What is NLP, and what’s an example?
Natural language processing (NLP) is the branch of computing that lets systems interpret and generate human language. An example in reporting: a user types “show me last quarter’s downtime by well,” and the NLP layer identifies the intent (a filtered trend query), the entities (downtime, well, last quarter), and passes that to a query engine.
What are the typical steps in natural language processing for reporting?
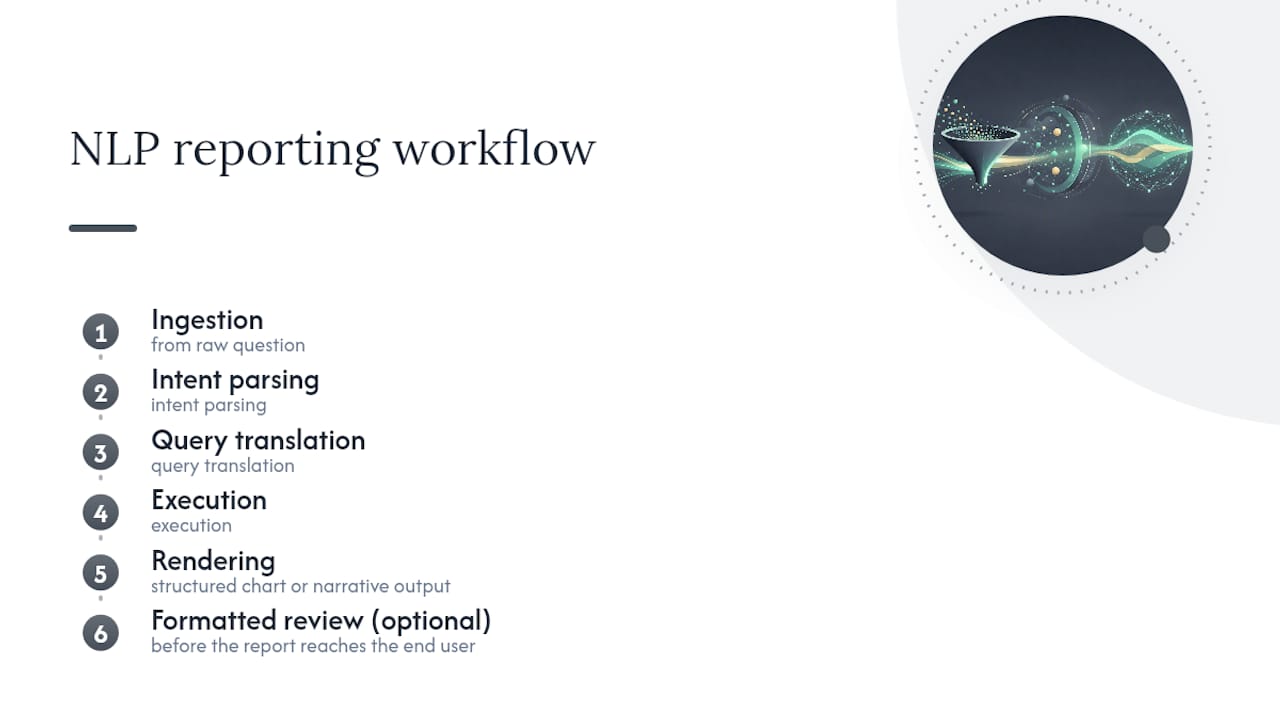
A common workflow runs through ingestion, intent parsing, query translation, execution, and rendering, moving from raw question to a structured chart or narrative output. Some implementations add a fifth explicit step: a formatted review or approval stage before the report reaches the end user.
How is NLP different from AI?
NLP is a specific subfield of artificial intelligence focused on language understanding and generation, while AI is the broader umbrella covering everything from computer vision to robotics. A natural language reporting system uses NLP as one component, alongside query engines, data warehouses, and often a separate visualization layer.
Can natural language reporting replace traditional dashboards entirely?
Not for every use case. Fixed, high-stakes reports like investor distributions or regulatory filings still benefit from vetted templates and human review, while natural language reporting excels at exploratory, one-off questions that would otherwise require a custom report request.