Digital Transformation in Oil and Gas: A 2026 Operator's Guide
A business-led digital transformation in oil and gas is not an IT project. It is a deliberate program that uses data foundations, IoT sensors, cloud infrastructure, and AI to improve asset performance, capital efficiency, and safety — and the operators who treat it that way are already pulling ahead.
Three things you can do right now, before reading the rest of this guide:
- Identify your top one or two high-value use cases. Predictive maintenance on artificial lift, per-well P&L visibility, and drilling optimization consistently deliver the fastest payback. Pick the one that maps to your biggest cost or production gap.
- Secure and clean the data those use cases require. Assign a named data owner. Audit what you actually have versus what you need. Fragmented, siloed data is the single biggest reason pilots fail before they scale.
- Run a 3–6 month domain-embedded pilot. Put data scientists and engineers on the same asset team. Keep the scope narrow. Measure against pre-agreed KPIs and use the results to build your internal investment case.
The OSDU Forum has established open data standards that make cross-vendor, cloud-agnostic interoperability achievable — a critical foundation if you plan to scale beyond a single pilot. Wellsmanager, as an upstream operations OS, is one example of how a purpose-built platform can operationalize this roadmap from day one.
Key Takeaways
Digital transformation in oil and gas delivers measurable financial and operational results only when it is business-led, data-grounded, and governed by a named value owner accountable for specific KPIs.
| Point | Details |
|---|---|
| Business-led framing | Start from the high-value business decision, not the technology; IT-led pilots consistently underdeliver on adoption. |
| Market value at stake | EY projects digital solutions could add more than US$790 billion to the upstream sector from 2026–2035, with US$2.80 of value per US$1 spent. |
| Data foundation first | Clean, owned, and integrated data is the prerequisite for every AI and digital twin use case; assign a named data steward before the pilot starts. |
| Realistic timelines | Pilots deliver proof in 3–6 months; measurable KPI improvement at scale takes 6–24 months; enterprise transformation runs 2–5 years. |
| Wellsmanager as operations OS | Wellsmanager centralizes per-well P&L, field maintenance, vendor management, and compliance in one platform, accelerating the pilot-to-scale journey for upstream operators. |
Table of Contents
- What does digital transformation actually mean for oil and gas?
- What does the 2026 market outlook mean for U.S. operators?
- Where does digital deliver value across the oil and gas lifecycle?
- Which core technologies are actually moving the needle?
- What barriers stall digital programs, and how do you get past them?
- How do you build a phased, business-led roadmap?
- How do you measure ROI, and what timelines are realistic?
- What do real deployments look like, and what can smaller operators learn?
- How does an operations OS like Wellsmanager map to this roadmap?
- What should U.S. operators prioritize next?
- Wellsmanager gives upstream operators a faster path to per-well clarity
- Sources
What does digital transformation actually mean for oil and gas?
The industry uses three terms interchangeably, and that confusion causes real project failures. Here is the precise distinction:
Digitization converts analog records to digital format. A paper well log scanned into a PDF is digitization. The process has not changed; only the medium has.
Digitalization automates processes using digital data. Connecting field sensors to a SCADA system so a dispatcher sees tank levels in real time is digitalization. Efficiency improves, but the underlying business model stays the same.
Digital transformation changes how decisions are made and how value is created. When per-well P&L data flows automatically to an operator’s dashboard and triggers a workover decision without a spreadsheet in sight, that is transformation. The business model, the decision rights, and the operating rhythm have all shifted.
Deloitte’s research finds that many oil and gas companies have plateaued precisely because they digitalized without transforming — they automated bad processes instead of redesigning them. Advancing requires alignment between business and digital leaders, not just a technology deployment.
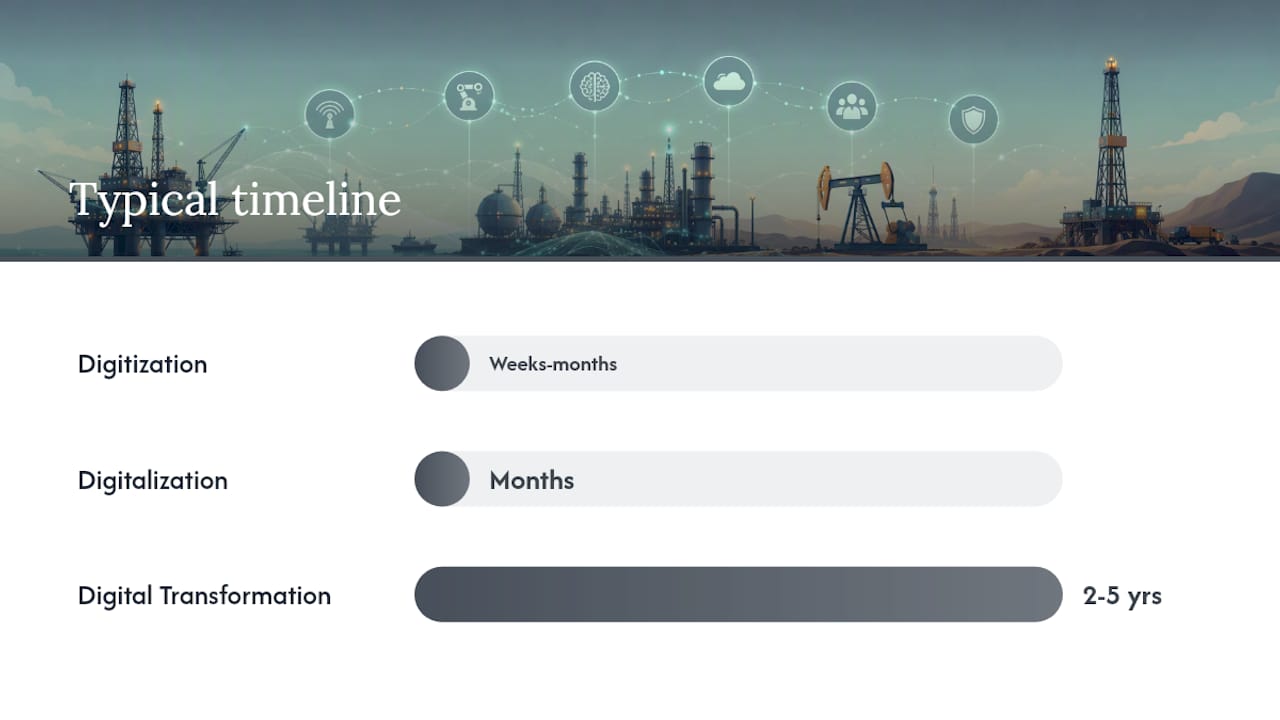
| Dimension | Digitization | Digitalization | Digital Transformation |
|---|---|---|---|
| Outcome | Digital records | Automated workflows | New decision models and value creation |
| Typical tools | Scanners, EDM systems | SCADA, ERP, IoT sensors | AI/ML, digital twins, cloud data platforms |
| Ownership | IT | IT + Operations | Business leadership |
| Timeline | Weeks to months | Months | 2–5 years |
The business-led rule is simple: start from the high-value business decision you want to improve, then work backward to the data and technology required. Starting from the technology and hoping a use case emerges is how budgets disappear without results.
What does the 2026 market outlook mean for U.S. operators?
The numbers make a compelling investment case. EY’s analysis projects that digital solutions could add more than US$790 billion of value to the upstream sector between 2026 and 2035, with global spend on digital solutions estimated at US$24 billion in 2026 and expected to reach US$38 billion by 2035. That implies roughly US$2.80 of value created for every US$1 spent.
$320 billion in potential sector savings by 2030 through drilling optimization, predictive maintenance, and related use cases — a Rystad estimate cited by DXC Technology.
For U.S. independent operators, the practical implication is that the cost of not investing is rising faster than the cost of investing. Three near-term trends are shaping where that investment goes:
- AI and GenAI pilots are accelerating. Operators who ran narrow ML experiments in 2023–2024 are now deploying GenAI for report generation, anomaly summarization, and regulatory compliance drafting. The productivity gains are real, but governance frameworks are lagging.
- Sovereign and private cloud choices are hardening. Operators handling sensitive reservoir data are making deliberate decisions about where data lives — on AWS, Azure, or GCP, or in a private cloud — rather than defaulting to whatever the vendor offers.
- Data platform investment is the new infrastructure spend. The U.S. Energy Information Administration’s short-term energy outlook reinforces that production decisions need to track market signals in near real time, which requires a data platform, not a quarterly spreadsheet.
Where does digital deliver value across the oil and gas lifecycle?
Value does not appear uniformly across the value chain. The highest-return use cases cluster by lifecycle stage, and picking the right one for your operation matters more than picking the most sophisticated technology.
Upstream: where the biggest gains are
Upstream is where digital tools have the most documented impact, largely because the data density is highest and the cost of a bad decision is largest.
- Drilling optimization: Real-time telemetry combined with physics-based models can reduce non-productive time and optimize weight on bit, rotary speed, and mud parameters. Pairing physical models with rich sensor data often delivers faster results than pure ML approaches — a point the SPE Journal of Petroleum Technology makes explicitly.
- Predictive maintenance on artificial lift: ESP and rod pump failures are among the most expensive unplanned events for U.S. independents. Vibration and current-signature sensors feeding an ML model can flag anomalies 2–4 weeks before failure.
- Per-well P&L tracking: Most operators still aggregate financials at the field or lease level. Moving to per-well P&L visibility changes which wells get workovers, which get plugged, and how capital gets allocated.
KPIs: production uplift (%), unplanned downtime (hours/year), OPEX per BOE.
Midstream: monitoring and scheduling
- Pipeline integrity monitoring using IoT pressure and flow sensors, combined with digital twins, lets operators detect anomalies before they become reportable incidents. Eco-Lift Energy Services is one example of a field service provider integrating digital monitoring into pipeline maintenance programs.
- Operations scheduling using demand-signal data reduces compression idle time and improves throughput on virtual pipeline and mobile compression operations.
- OT/ICS cybersecurity is a growing concern as pipeline control systems connect to cloud platforms. The attack surface expands with every new sensor.
KPIs: pipeline availability (%), incident response time (hours), compression utilization (%).
Downstream: forecasting and refinery optimization
Demand forecasting models fed by market data and logistics signals reduce feedstock over-purchasing. Refinery asset optimization using digital twins of heat exchangers and distillation columns can cut energy consumption and extend turnaround intervals.
KPIs: energy intensity (MMBtu/barrel), maintenance cost per asset, turnaround cycle time.
Aramco’s digitalization program — which spans IoT sensors, drones, and robotics — has reported inspection time reductions of up to 90% at some facilities and energy and maintenance cost reductions in the high-teens to low-30s percentages, including roughly 18% lower power consumption and 30% lower maintenance costs at the Khurais field.
Which core technologies are actually moving the needle?
Six technology categories account for the vast majority of documented value in oil and gas digital programs. Each has a different maturity profile and a different entry point.
- IoT and edge computing: Sensors on wellheads, compressors, and pipelines generate the raw data everything else depends on. Edge processing reduces latency and bandwidth costs by filtering and aggregating data before it reaches the cloud. This is the foundation layer — without it, AI has nothing to work with.
- Cloud platforms (AWS, Azure, GCP): Cloud gives operators elastic compute for seismic processing, ML training, and financial consolidation without capital expenditure on on-premises infrastructure. The choice of provider matters less than the data architecture built on top of it.
- OSDU data platform: Upstream data is heterogeneous — seismic files run to petabytes, well logs come in dozens of formats, and production data lives in a dozen different systems. The OSDU Forum exists to standardize data platforms across vendors and clouds, enabling interoperability that would otherwise require years of custom integration work. Leading operators are now moving beyond standardization to semantic data architectures that unlock advanced AI use cases.
- AI and machine learning: The impact of AI in the oil industry spans production optimization, predictive maintenance, drilling parameter recommendation, and now GenAI for report generation and regulatory summarization. The key constraint is data quality, not algorithm sophistication.
- Digital twins: A digital twin is a live virtual model of a physical asset — a well, a compressor, a pipeline segment — updated continuously with sensor data. BP has used digital twins alongside robotics to lift production approximately 2% per year and protect roughly 4% more production from going offline, according to Energy Digital.
- Robotics and automation: Drones for inspection, autonomous vehicles for remote sites, and robotic process automation for back-office workflows all reduce labor costs and improve safety in hazardous environments.
| Technology | Best early application | Maturity required | Lifecycle fit |
|---|---|---|---|
| IoT / edge | Wellhead monitoring, ESP diagnostics | Low | Upstream, midstream |
| Cloud platforms | Seismic processing, financial consolidation | Low–medium | All stages |
| OSDU data platform | Cross-system data integration | Medium | Upstream |
| AI / ML | Predictive maintenance, production optimization | Medium | Upstream, downstream |
| Digital twins | Asset simulation, scenario planning | Medium–high | Midstream, downstream |
| Robotics / automation | Inspection, remote operations | High | All stages |
Pro Tip: Don’t start with digital twins. Start with IoT sensors and a clean data pipeline. A digital twin built on bad or incomplete sensor data is just an expensive wrong answer.
What barriers stall digital programs, and how do you get past them?
Most oil and gas digital programs do not fail because the technology does not work. They fail because of organizational and data problems that were visible before the project started.
Legacy systems and OT/ICS integration
The biggest technical barrier is connecting new digital tools to aging operational technology — SCADA systems, historians, and industrial control systems that were never designed for cloud connectivity. The answer is not a rip-and-replace. Martin Fowler’s legacy displacement patterns — event interception, legacy mimic, and segment-by-product approaches — let you break a large replacement into deliverable increments. A parallel run, where the new system operates alongside the old one until trust is established, dramatically reduces operational risk.
Pro Tip: Identify the “seam” in your legacy system where data can be intercepted without touching the core. A read-only data tap on a historian is often enough to start a predictive maintenance pilot without any changes to the control system.
Data silos and quality
Fragmented data is the most common reason a pilot cannot scale. Production data lives in one system, maintenance records in another, financial data in a spreadsheet. Before any AI model can run, someone has to reconcile those sources. Assign a named data steward for each domain. Define a minimal viable dataset for the pilot use case and clean that dataset first — not everything.
Change resistance and culture
Oil and gas organizational culture rewards engineering judgment built over decades. A model that recommends a different drilling parameter than the driller’s instinct will be ignored unless the driller was involved in building it. Embedding data scientists into asset teams — not into a central IT function — is the most effective mitigation. PwC’s research on digital transformation in oil and gas makes this point directly: business-led programs with domain experts co-owning the models outperform IT-led deployments on adoption metrics.
ROI uncertainty and budget cycles
Capital allocation in oil and gas follows commodity prices. Digital investments compete with drilling programs for the same budget.
Cybersecurity
As OT systems connect to cloud platforms, the attack surface grows. The Colonial Pipeline incident in 2021 remains the clearest U.S. example of what happens when IT/OT security is treated as an afterthought. Segment OT networks, enforce zero-trust access controls, and run tabletop exercises before connecting any field device to a cloud platform.
How do you build a phased, business-led roadmap?
A transformation that tries to do everything at once does nothing well. The phased approach below is designed for U.S. independent operators with limited digital staff and real capital constraints.
- Assess value (months 1–2). Map your top five business decisions that cost the most when made slowly or incorrectly. Score each by financial impact and data availability. The intersection of high impact and available data is your pilot.
- Build data foundations (months 2–4). Inventory existing data sources. Assign data stewards. Establish a minimal viable data pipeline for the pilot use case. If OSDU-compatible tooling is available, adopt it now — retrofitting data standards later is expensive.
- Run a domain-embedded pilot (months 3–9). Put a data scientist and a domain engineer on the same team. Define success criteria before the pilot starts: specific KPI targets, a measurement baseline, and a decision rule for scaling or stopping.
- Scale with governance (months 9–24). Stand up a steering committee with a named value owner (a business leader, not an IT leader), a data steward, and an engineering squad. Formalize the change management plan. Bring in vendor and partner capabilities where internal capacity is thin.
- Optimize and iterate (year 2 onward). Treat the program as a product, not a project. Run quarterly reviews against KPIs. Retire use cases that are not delivering. Add new ones as data maturity improves.
Governance model essentials:
- Steering committee: CFO or VP Operations as chair, digital lead as program manager
- Value owner: the business leader accountable for the KPI the use case targets
- Data steward: named owner of each data domain (production, maintenance, financial)
- Engineering squad: 2–4 people per active use case, including at least one domain expert
- Vendor/partner roles: defined scope, data access rights, and exit criteria
Execution artifacts to create in the first 60 days: a use-case canvas (one page per use case: business question, data required, KPI, owner, timeline), a data inventory, pilot success criteria, and a 12–24 month delivery cadence.
A pilot team of four to six people — one data scientist, one domain engineer, one business analyst, and a part-time data steward — is enough to run a credible first use case. Budget for cloud compute, data tooling, and change management, not just software licenses.
How do you measure ROI, and what timelines are realistic?
Setting expectations correctly at the start is what keeps digital programs funded through a commodity downturn. The table below shows what is realistic by phase.
| Phase | Timeline | Expected outcomes |
|---|---|---|
| Pilot | 3–6 months | Proof of concept, baseline KPI measurement, go/no-go decision |
| Scale | 6–24 months | Measurable KPI improvement, 2–3 use cases in production |
| Transformation | 2–5 years | Business model changes, enterprise-wide data platform, sustained OPEX reduction |
Primary KPIs to track:
- Production uplift (% increase in BOE/day per well or field)
- Unplanned downtime reduction (hours/year, or downtime as % of available time)
- OPEX per BOE ($/BOE, tracked monthly)
- Maintenance cost per asset ($/asset/year)
- Cycle time reductions (days from decision to action for workovers, well completions)
- Per-well P&L accuracy (variance between forecast and actual, %)
Sample ROI calculation — predictive maintenance on artificial lift:
Assume a 50-well Permian Basin operation. Average ESP failure costs $85,000 in workover and lost production. Historical failure rate: 8 failures per year.
- Conservative scenario: 3.2 fewer failures per year × $85,000 = $272,000 annual savings
- Optimistic scenario: 4.8 fewer failures per year × $85,000 = $408,000 annual savings
- Pilot cost (data scientist, cloud compute, sensor upgrades): approximately $120,000–$180,000
Payback in year one, with the model improving as more failure data accumulates. That is the kind of calculation that survives a CFO review.
The IEA’s technology pathway analysis also points to digital monitoring as a lever for emissions reduction — an increasingly relevant KPI as U.S. methane reporting requirements tighten.
What do real deployments look like, and what can smaller operators learn?
Three deployments illustrate what is achievable and, more importantly, what made it work.
ADNOC’s AI-enabled real-time operations center combined live rig data, dashboards, and AI-generated insights in a sovereign cloud environment. The result: engineering effort dropped by 30–40%, engineers could support two to three times more rigs simultaneously, and incident response times fell by 4–12 hours. The lesson for smaller operators is not to replicate the scale — it is to centralize monitoring before adding AI. The operations center worked because the data infrastructure was already in place.
The practical lesson is that digital twins deliver the most value when connected to live sensor feeds, not when built as static simulation models.
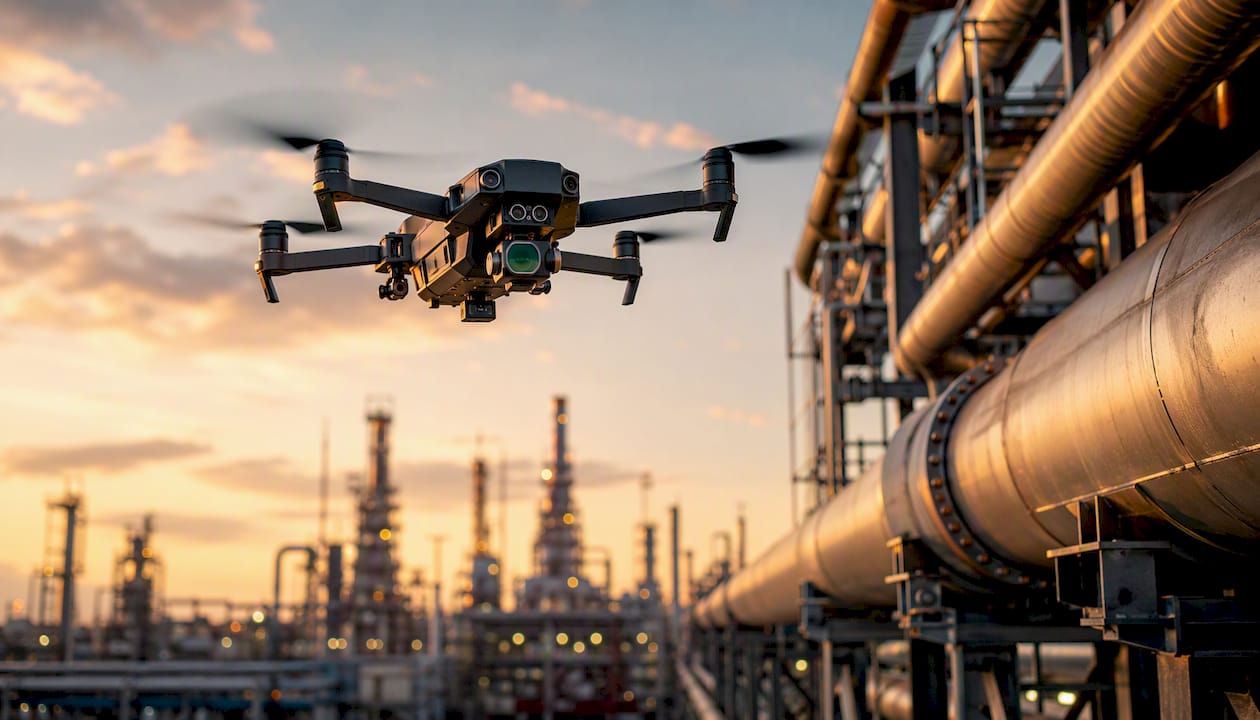
The lesson for independents: drone-based inspection is one of the fastest-payback digital investments available, with low integration complexity and immediate safety benefits.
What to avoid: The most common pilot failure pattern is a technology-led proof of concept with no named business owner, no baseline measurement, and no decision rule for scaling. These pilots produce a slide deck, not a production system. Scope the use case to a single asset or field, define the KPI before the pilot starts, and require a business leader to sign off on the success criteria.
How does an operations OS like Wellsmanager map to this roadmap?
A purpose-built operations platform accelerates the pilot-to-scale journey by eliminating the data integration work that consumes most of a pilot’s budget. The table below maps Wellsmanager’s capabilities to the roadmap phases and the KPIs they support.
| Platform capability | Roadmap phase | KPI supported |
|---|---|---|
| Per-well P&L tracking | Assess value, Scale | OPEX per BOE, per-well profitability |
| Lease operating statements | Scale, Optimize | Financial accuracy, investor reporting |
| Field maintenance logging | Pilot, Scale | Downtime %, maintenance cost per asset |
| Vendor and asset management | Scale, Optimize | Procurement cycle time, vendor cost variance |
| AI-powered executive briefs | Scale, Optimize | Decision cycle time, reporting efficiency |
| Investor distribution automation | Scale, Optimize | Investor communication accuracy |
| Real-time compliance notifications | All phases | Regulatory risk, audit trail completeness |
For operators evaluating an operations OS, the implementation checklist below covers the critical integration and configuration decisions:
- Data ingestion: Confirm the platform can ingest production data from your existing SCADA or historian. Define the frequency (daily, hourly, real-time) required for your priority use case.
- P&L alignment: Map your chart of accounts to the platform’s expense categories before go-live. Per-well P&L is only useful if the cost allocation logic matches your accounting structure.
- Role configuration: Define which users see which wells and which financial data. Field operators, financial officers, and investors need different views.
- Integration points: Identify connections to ERP (accounts payable, payroll), SCADA (production volumes), and any existing compliance systems. A single source of truth for upstream operations depends on these integrations being clean from day one.
- Audit trail setup: Configure audit logging before any financial data enters the system. Retroactive audit trails are incomplete by definition.
- Pilot success criteria: Agree on the KPI baseline and target before onboarding. For most operators, a 90-day pilot covering per-well P&L and field maintenance logging is enough to validate the platform’s fit.
Automating the invoice approval workflow from field to finance is one of the fastest wins available on an operations OS — it removes a manual reconciliation step that typically consumes 4–8 hours per week for a field administrator.
What should U.S. operators prioritize next?
The gap between operators who are capturing digital value and those who are still running on spreadsheets is widening faster than most people in the industry acknowledge. Three observations from watching this play out across U.S. upstream operations:
First, governance is the bottleneck, not technology. The operators who have stalled are not short of tools — they are short of a named business leader who owns the outcome. Every successful digital program I have seen in this industry has a VP of Operations or a CFO who treats the KPI as their personal accountability, not a digital team’s deliverable.
Second, the data foundation work is unglamorous and non-negotiable. Operators who skip it and go straight to AI pilots spend the first six months of the pilot cleaning data instead of generating insights. The equipment downtime tracking problem is a good example: the data exists in maintenance logs, work orders, and field reports, but it is rarely in a form that a model can use without significant preparation.
Third, GenAI is closer to production-ready for oil and gas back-office workflows than most operators realize. Start there, build trust in AI-generated outputs, and use that trust to fund the harder infrastructure work.
The common trap is the opposite sequence: spend two years building a data platform, then try to justify it with a GenAI use case that could have run on a spreadsheet. Pick the use case first, build only the data infrastructure that use case requires, and let the platform grow from there.
Wellsmanager gives upstream operators a faster path to per-well clarity
Most independent operators spend more time reconciling spreadsheets than analyzing the numbers inside them. Wellsmanager is built specifically to close that gap: it centralizes well tracking, field maintenance logs, vendor expenses, lease operating statements, and per-well P&L in a single platform, replacing the manual workflows that slow down financial and operational decisions.
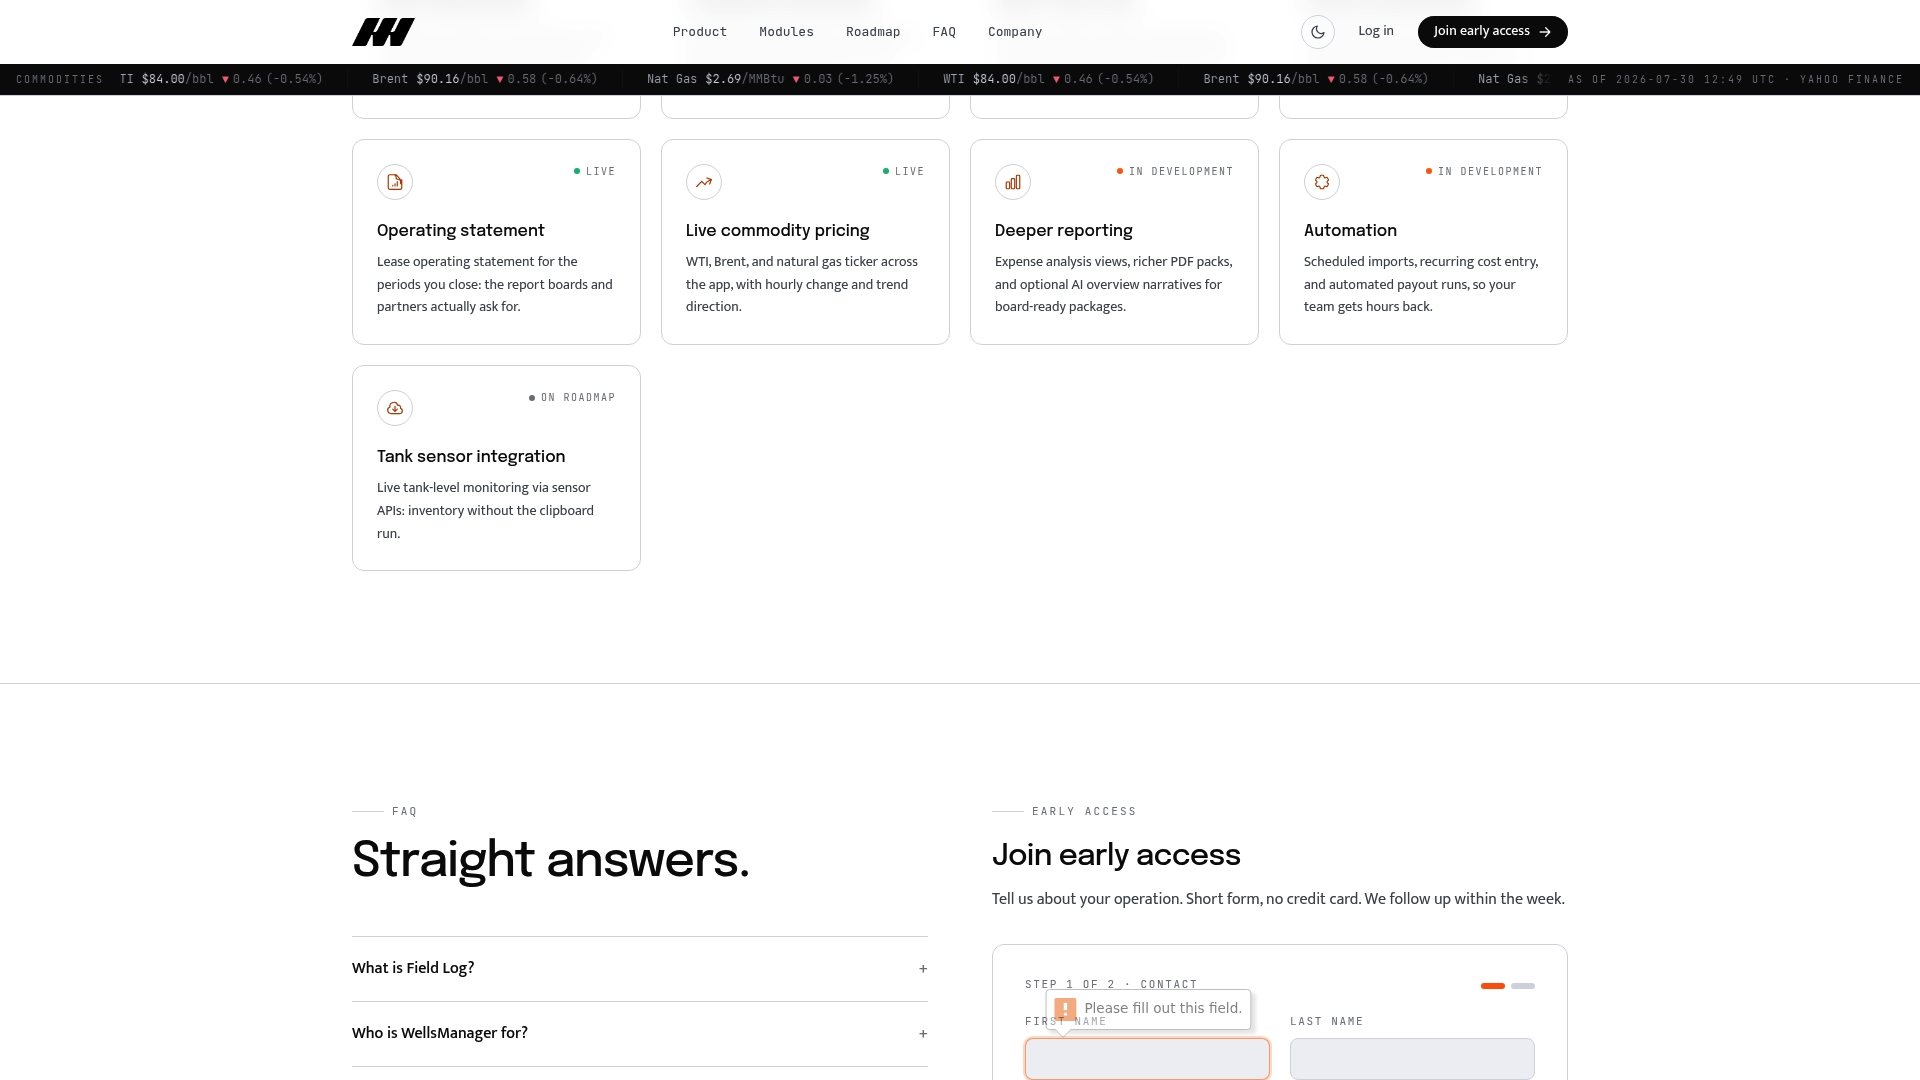
The platform’s AI-powered executive briefs mean your leadership team gets a clear operational summary without anyone spending a Friday afternoon pulling reports. Compliance notifications fire automatically, audit trails are built in from day one, and investor distributions run without a separate reconciliation step. For operators running 10 to 500 wells, onboarding a pilot asset group typically takes two to four weeks. Request access to Wellsmanager to see how the platform maps to your operation, or visit Wellsmanager to review the full module set.
Sources
The sources below support the claims in this guide and are worth consulting directly for technical depth, market data, and standards guidance.
- Seizing the digital opportunity in upstream oil and gas | EY - UK
- Digital Transformation in Oil and Gas: 2026 Outlook | DXC Technology
- Digital Transformation in Oil and Gas | Deloitte US
- A grand challenge: digital transformation for the upstream oil and gas industry