Cost Anomaly Detection for Upstream Wells: A Practical Guide

Cost anomaly detection means identifying unexpected or out-of-pattern field and well operating expenses that distort your per-well P&L and lease operating statement before they erode margin. The recommended first move is a short pilot on a handful of wells to surface high-value anomalies and prove ROI fast. Research on well-level economics shows that profitability data is often siloed across production, maintenance, and finance systems, which is exactly why field-wide averages hide loss-making wells. Wellsmanager is built to run that kind of pilot without months of IT setup.
Key Takeaways
Cost anomaly detection works when per-well data is consolidated, baselined against its own history, and reviewed through a defined escalation process rather than left as a monthly reporting exercise.
| Point | Details |
|---|---|
| Define anomalies at the well level | Field-wide averages hide loss-making wells; baseline each well against its own trailing history. |
| Consolidate before you detect | Join production, maintenance, invoices, and LOS data on canonical well IDs before building any model. |
| Start simple, add complexity later | Rules and statistical baselining first, time-series and ML only after data quality is proven. |
| Validate before booking savings | Use control wells, conservative attribution, and finance sign-off before claiming ROI. |
| Wellsmanager accelerates the pilot | Field Log, invoice workflow, and per-well P&L reporting cover most of the six-step deployment checklist out of the box. |
Table of Contents
- What Do Cost Anomalies Look Like on a Well?
- What Data Do You Need to Consolidate First?
- Which Detection Method Actually Fits Your Data?
- How Do You Deploy a Cost Anomaly Pilot in Six Steps?
- How Do You Prove the Pilot Actually Worked?
- What Pitfalls Derail Most Anomaly Detection Programs?
- How Does Wellsmanager Support Each Step of a Pilot?
- How Much Does a Detection Program Cost and How Long Does It Take?
- How Should You Act Once an Anomaly Is Confirmed?
- Sources
- FAQ
What Do Cost Anomalies Look Like on a Well?
Cost anomalies rarely announce themselves. They show up as small line-item drifts that add up until someone finally pulls the LOS apart well by well.
- A single well’s workover or repair spend spikes 3x above its trailing 12-month average with no corresponding production event.
- The same vendor invoice appears twice in one month, sometimes with a slightly different reference number.
- Water-handling and disposal costs climb steadily even though produced water volumes are flat.
- Chemical injection costs rise without a matching change in corrosion or scale conditions.
- Transportation or treatment surcharges creep upward after a midstream contract amendment nobody flagged internally.
Here’s the scenario that catches operators off guard: a high-flow well looks like a top performer on a production report, but once you allocate its share of shared-facility LOE, water disposal, and a lingering compressor repair bill, it’s actually running at a loss. Anomalies surface across multiple signals at once, usually an invoice, a field log entry, and a production number that don’t agree with each other.
Pro Tip: Start with a simple variance filter that flags any well whose monthly LOE moves well outside its own recent baseline, not a field-wide average. Wells with genuinely different completion designs or water cuts will always look “anomalous” against a group average, even when nothing is wrong.
What Data Do You Need to Consolidate First?
Detection is only as trustworthy as the data feeding it. Most operators already have every input; it just lives in five different systems that don’t talk to each other.
You need, at minimum: per-well production volumes, daily or monthly sales, maintenance logs including field work orders and parts, vendor invoices, LOS and LOE records, water-handling and disposal costs, chemical usage, transportation and treatment charges, and the contract terms that govern how shared costs and revenue get split.
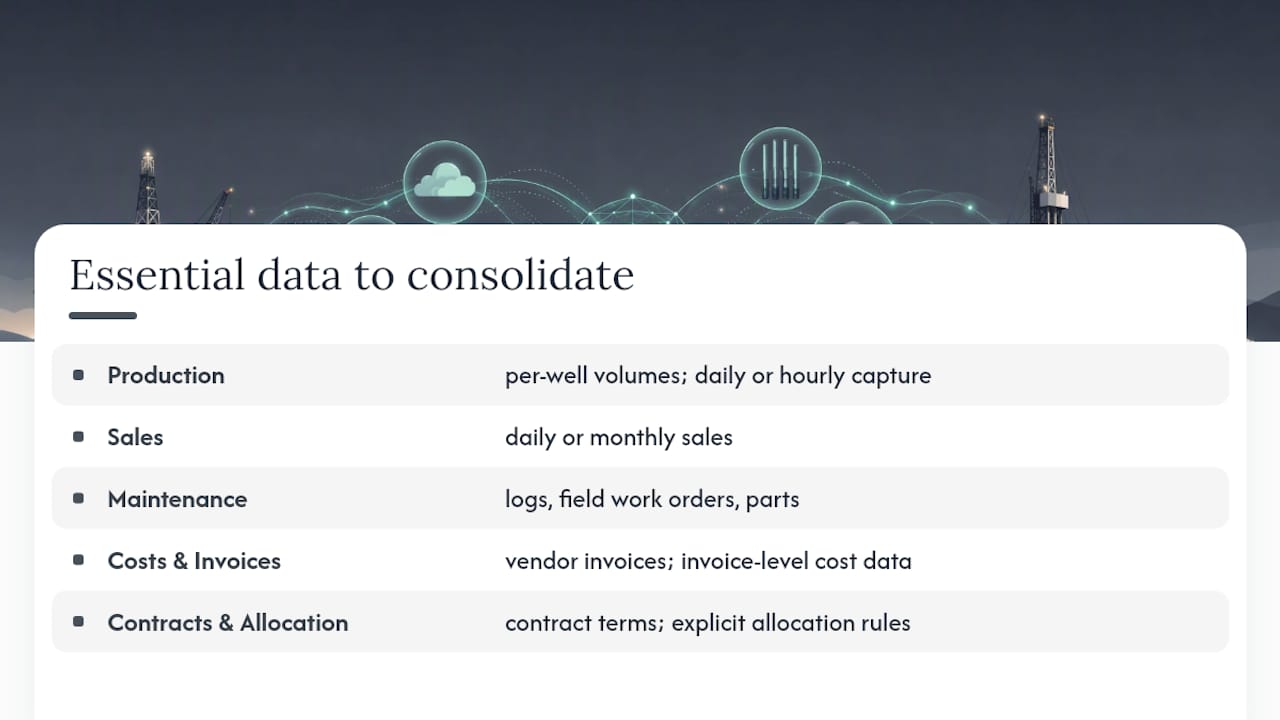
Resolution matters more than most people expect. Production data should be captured daily or hourly where possible; cost data needs to sit at the invoice level, not the monthly rollup. Join everything on canonical keys, well ID, pad, lease, and invoice reference, so a cost can be traced back to a specific well without manual reconciliation.
Allocation is where most detection efforts quietly fall apart. Volume-based allocation works for costs that scale with output. Run-hours make more sense for equipment-linked costs like compression or pumping. Shared facilities and third-party services need explicit assignment rules agreed on in advance, not guessed at during month-end close.
Which Detection Method Actually Fits Your Data?
Not every operator needs machine learning on day one, and honestly, most shouldn’t start there.
Rule-based thresholds are the simplest entry point. Flag any invoice above a dollar limit, any well whose maintenance spend exceeds last quarter’s by a fixed percentage. They’re easy to explain to a finance reviewer and catch known problem patterns fast, but they get brittle. A threshold tuned for one well type will either miss real problems on another or throw false alarms constantly.
Statistical outlier methods, z-scores, interquartile range checks, residual analysis against a rolling baseline, handle normal variance better than fixed thresholds. They need a decent baseline period and some normalization for well type, water cut, and depth, but they’re still explainable to a non-technical auditor.
Time-series residual models go a step further by accounting for seasonality and production-cycle correlation. If chemical costs naturally rise during workover season, a seasonality-aware model won’t flag that as an anomaly the way a flat statistical check might.
Machine learning approaches, clustering, isolation forests, anomaly-score models, catch subtler patterns that rules and stats miss entirely. The tradeoff is real: these models demand more data, more compute, and a harder explainability conversation when finance asks “why did this get flagged?”
The practical sequence for most independent operators:
- Start with rules and statistical baselining on your highest-spend wells.
- Layer in time-series residuals once you have at least a year of clean, joined data.
- Pilot an ML model only after the simpler methods are running reliably and a human is validating flags weekly.
Pro Tip: *Any model feeding a finance decision needs to be explainable in one sentence to an investor.
Latency matters too. A monthly batch review catches problems weeks late; a system that flags anomalies within days of invoice entry lets you act before the next distribution cycle closes.
How Do You Deploy a Cost Anomaly Pilot in Six Steps?
A pilot doesn’t need a data science team. It needs clear ownership and a scope small enough to finish in weeks, not quarters.
- Scope and objectives — pick 5 to 25 wells with a mix of good and questionable economics. Ops lead owns this.
- Gather canonical data — pull production, maintenance, invoices, and LOS records into one joined dataset. Data owner (often finance or IT) drives this.
- Baseline and normalize — establish a 6 to 12 month trailing baseline per well, adjusted for well type. Ops lead and finance collaborate here.
- Select initial detection rules — set thresholds and statistical checks tuned to the pilot wells, not the whole field. Ops lead owns.
- Route alerts into an approval workflow — every flagged anomaly needs a named reviewer and a deadline. Finance reviewer owns sign-off.
- Measure and iterate — track detection accuracy and refine thresholds monthly. IT/automation owns the tooling; finance owns the numbers.
Choose pilot wells that maximize learning, mix a strong producer, a marginal well, and one you already suspect is underperforming. Before launch, decide who signs off on escalation thresholds and who holds remediation authority once a vendor dispute or workover decision is on the table. Skipping that conversation is how pilots stall at the “we found something” stage and never reach “we fixed something.”
How Do You Prove the Pilot Actually Worked?
Detection without validation is just noise with better formatting. Track these metrics from day one:
- Per-well net contribution before and after remediation.
- LOE variance against baseline, tracked monthly per well.
- Days-to-detect, how long between an anomaly occurring and someone flagging it.
- Percentage of confirmed anomalies out of total flags (your false-positive rate, inverted).
- Mean time to remediate once an anomaly is confirmed.
- Realized cost savings, booked only after finance confirms the fix.
Design the pilot with a control group where possible: a set of comparable wells running the old review process alongside your pilot wells. Compare a pre-period to a post-period of equal length, and apply conservative attribution, if a vendor price drop coincided with your pilot, don’t claim the full delta as detection-driven savings.
One platform combining analytics with automated LOS review reported expense savings on the order of thirty percent once disparate cost data was consolidated and reviewed on a predictable cadence. That’s a useful reference point for a realistic pilot target, not a guarantee.
Build a simple dashboard for executives and investors: net contribution trend, confirmed anomaly count, and cumulative savings. Investors care less about the model and more about whether distributions are more predictable now.
What Pitfalls Derail Most Anomaly Detection Programs?
Most failed pilots don’t fail because the math was wrong. They fail because of process gaps nobody planned for.
- Allocation errors create false positives; a well flagged for high LOE might just be absorbing a bigger share of a shared facility cost.
- Siloed systems with mismatched keys mean the same well shows up under three different IDs across production, maintenance, and accounting software.
- Delayed invoicing creates lagged spikes that look like a current-month anomaly when the cost actually happened two months ago.
- Over-alerting trains operators to ignore alerts entirely, the classic fatigue problem.
- Treating detection as a one-off project instead of an ongoing discipline lets old problems creep back within a quarter.
Fix allocation issues with clear governance and canonical keys, not more thresholds. Build an invoice-lag window into your baseline calculations so a late bill doesn’t get miscounted as this month’s anomaly. Batch and prioritize alerts by dollar impact so reviewers see the five that matter, not fifty that don’t. Finance should own final confirmation before any savings get booked, and someone specific, not “the team”, needs to own closing the loop with vendors on disputed charges.
How Does Wellsmanager Support Each Step of a Pilot?
Wellsmanager maps directly onto the six-step deployment checklist rather than requiring a separate detection tool bolted on afterward.
- Data consolidation and LOS automation replace the manual joins that usually eat the first month of any pilot.
- Mobile Field Log captures maintenance costs and field events in real time, closing the gap between when work happens and when it hits the books.
- Invoice capture and approval workflow catches duplicate billing and delayed invoices before they distort a monthly LOS.
- Per-well P&L reporting gives you the baseline and ongoing variance tracking the whole method depends on.
- Alerting routed into existing workflows means flagged anomalies land with the right reviewer instead of sitting in an inbox.
- The AI connector lets an operations manager ask a plain-language question about a well’s cost trend and get an answer without waiting on a report cycle.
Step 2 of the checklist (gather canonical data) and step 5 (route alerts into approval) are usually where pilots lose the most time manually. Those are the two areas where Wellsmanager’s Field Log and invoice workflow save the most weeks.
How Much Does a Detection Program Cost and How Long Does It Take?
A rules-and-statistics pilot on 5 to 25 wells typically runs 4 to 8 weeks from data consolidation to first validated results, assuming your production, maintenance, and invoice data already exist somewhere, even if scattered. Most of that time goes to consolidation and baseline-building, not the detection logic itself.
Cost depends heavily on your starting point. An operator already running spreadsheet-based LOS tracking faces a heavier lift than one on a platform with existing per-well reporting, because someone has to manually reconstruct joined datasets before any baseline is possible. That manual reconciliation work, not software licensing, is usually the biggest hidden cost in a DIY build.
A managed operations platform shortens this considerably because the data model, well IDs, and cost categories already exist. In that case, the pilot timeline shrinks to data import and threshold-tuning rather than building a data architecture from scratch. Digital well cost management platforms have reported cost estimation accuracy up to 95% once scope changes are controlled, a reasonable benchmark for what a mature system should deliver.
Layering in time-series or ML methods adds real time, generally another 2 to 3 months of data collection and validation before those models are trustworthy enough for a finance conversation. BCG’s analysis of upstream cost programs notes that sustained savings usually require pairing detection tools with structural process changes, not software alone. Budget for the process change, not just the tooling.
How Should You Act Once an Anomaly Is Confirmed?
Detection without a remediation path just generates reports nobody reads. Every confirmed anomaly needs a prioritization rule, an escalation owner, and a deadline.
Prioritize by dollar impact first, then by recurrence risk. A one-time $2,000 billing error matters less than a $500-a-month water-handling drift that will keep compounding. Rank flagged anomalies into three tiers: immediate action (active revenue or safety impact), scheduled review (confirmed but not urgent), and monitor (borderline, needs another cycle of data before acting).
Escalation should follow a fixed path: field operations confirms the anomaly is real, not a data or timing error, then routes it to whoever owns that cost category, a maintenance supervisor for equipment issues, a vendor manager for invoicing disputes, finance for allocation corrections. Set a response deadline for each tier, 48 hours for immediate-action items, one week for scheduled review.
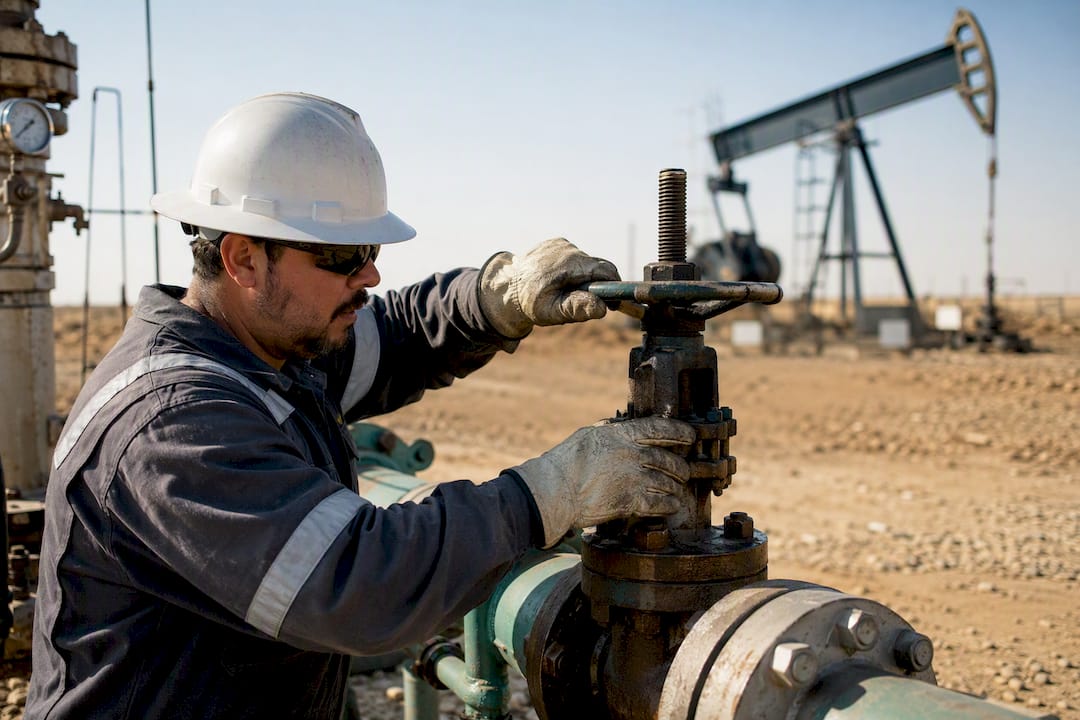
Remediation closes the loop. For vendor issues, that means a documented dispute and resolution before finance books any savings. For equipment issues, usage-based maintenance programs have shown measurable reductions in repeat failures when condition data feeds the maintenance schedule directly, worth considering if the same well keeps tripping the same alert. Facility-level fugitive losses and inefficiencies are another recurring source of avoidable cost, and directed inspection and maintenance programs have identified these systematically at processing plants. Track third-party field services through your existing vendor management process, and if you work the Permian, a service partner like Eco-Lift Energy Services is worth having in that vendor pool for well servicing needs that surface during remediation.
Why Cost-First Beats Volume-Only Thinking
Volume optimization gets the attention because it’s visible on a production report. Per-well P&L is less flattering but more honest: it’s the only view that shows you which wells are quietly bleeding cash under a shared-facility allocation nobody’s questioned in years. Run a pilot on your weakest-looking wells first. You’ll likely find short-term savings and, just as valuable, a cleaner story to tell investors at the next distribution.
Start a Pilot Without Rebuilding Your Data Stack
You don’t need a data science hire or a six-month IT project to get a working anomaly detection pilot running. Wellsmanager already holds your production, maintenance, and invoice data in one per-well structure, so the consolidation step that normally eats a month of a pilot is mostly done on day one. A typical pilot runs a handful of weeks and ends with two deliverables: a confirmed anomaly report on your pilot wells and an ROI estimate finance can actually use. If you’re ready to see what’s hiding in your own lease operating statements, request access to WellsManager and get your pilot scoped this month.
Sources
- Profit and Loss at the Wellhead; Producing from the Wells that are Profitable and Shutting-in the Loss-makers
- Automated Lease Operating Statements for Cost Optimization and Reserve Evaluation Using Artificial Intelligence
- The development of marginal fields with limited budgets requires effective well cost management (IPTC case study)
- Shifting from calendar to usage-based maintenance: Proven results that demand your attention
- Can Upstream Energy Companies Maintain Reduced Costs? | BCG
- Cost-effective directed inspection and maintenance control opportunities
FAQ
What Is Cost Anomaly Detection in Oil and Gas?
It’s the process of identifying unexpected or out-of-pattern field and well operating expenses, vendor invoices, maintenance costs, water handling that distort a per-well P&L or lease operating statement.
How Long Does a Cost Anomaly Detection Pilot Take?
Most rules-and-statistics pilots on 5 to 25 wells take 4 to 8 weeks from data consolidation to validated results, assuming existing production and cost data can be joined without major rebuild work.
What Data Do I Need Before Starting Detection?
You need per-well production volumes, invoice-level vendor costs, maintenance logs, and LOS records joined on canonical keys like well ID and lease, ideally at daily or invoice-level resolution.
Can Machine Learning Replace Simple Threshold Rules?
Not right away. ML models catch subtler patterns but need more data and stronger explainability for finance review, so most operators start with rules and statistical baselining first.
How Does Wellsmanager Help With Anomaly Detection?
Wellsmanager consolidates production, maintenance, and invoice data into per-well P&L automatically, with a mobile Field Log and AI connector that speed up both cost capture and anomaly investigation.